Transcription of Chapter III World trade and economic growth, 2020-21
1 Chapter I I I. World trade and economic growth, 2020 -21. trade and GDP in 2020 and early 2021 22. Merchandise trade volume 23. Commodity prices 26. Exchange rates 27. Merchandise and services trade values 28. Leading indicators of trade 31. economic recovery from COVID-19 34. 10. 20. World merchandise trade volume and real Merchandise trade and commercial services GDP fell sharply in the first half of 2020 as trade in current US dollar terms plunged in the a result of the COVID-19 pandemic before early stages of the pandemic. Merchandise trade rebounding in the second half.
2 Consequently, rebounded strongly in the second half of 2020. trade and output declined less than initially but services continued to be weighed down by expected for the year. The volume of travel restrictions. The value of merchandise merchandise trade dropped by per cent in exports fell by 8 per cent in 2020 to US$ 2020 while real GDP at market exchange rates trillion while commercial services exports declined by per cent. dropped by 20 per cent to US$ trillion. The decline in merchandise trade in 2020 was The post-pandemic trade recovery is already less severe than forecasters predicted for a showing signs of divergence across countries number of reasons.
3 These included proactive and regions. Merchandise export and import fiscal and monetary policies that boosted volumes in the first quarter of 2021 rose to new incomes and consumption, an increase in heights in Asia and reverted to pre-pandemic demand for technological innovation to facilitate levels in Europe and North America but lagged remote work, and trade policy restraint that kept behind in poorer, less industrialized regions, supply chains functioning. such as Africa and the Middle East. 11. 21. World trade Statistical Review 2021. trade and GDP in 2020 and early 2021.
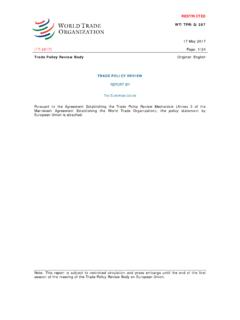
4 The volume of World merchandise trade declined significantly in 2020, with only the financial crisis of 2008-09 having seen a steeper decline. However, it could have been even greater in view of the contraction in GDP. Chart World merchandise trade volume and real GDP growth, 2014-20. (Annual percentage change). 6. 4. Annual percentage change 2 0. -2. -4 -6. 2014 2015 2016 2017 2018 2019 2020. trade GDP Average trade growth 2010-19 Average GDP growth 2010-19. Sources: WTO Secretariat for trade , consensus estimates for GDP. Note: GDP growth is calculated with market exchange rate weights.
5 The volume of World merchandise trade declined by The large decline in services trade is mostly due to travel per cent in 2020 as the COVID-19 pandemic restrictions and lockdowns, which prevented the delivery severely jolted the global economy. This followed a sharp of services requiring physical proximity. Some income decline in trade the previous year, with volume growth of not spent on services may have been diverted to goods, just per cent as trade tensions between leading nations supporting merchandise imports. remained high. The per cent decline in merchandise trade volume The decline in merchandise trade in 2020 was even in 2020 was accompanied by a per cent contraction larger when measured in nominal US dollar terms, in World real GDP at market exchange rates.
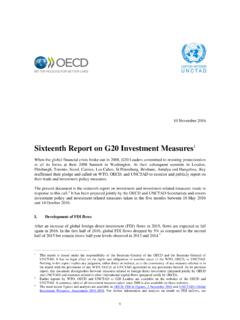
6 The trade with the value of exports falling by nearly 8 per cent decline was therefore times larger than the decline in to US$ trillion. The dollar value of commercial output. This is smaller than in 2009 following the global services exports declined even more, dropping by financial crisis, when trade volumes fell per cent, six 20 per cent to US$ trillion. times more than the per cent slump in GDP. 22. Chapter III: World trade and economic growth, 2020-21 . Merchandise trade volume The 2020 contraction in the volume of merchandise trade started in the first quarter and accelerated in the second.
7 The subsequent rebound in the third and fourth quarters was strong enough to return merchandise trade to its pre- pandemic level by the end of the year. Chart World merchandise trade volume, 2015Q1-2021Q1. (Volume index 2015 =100 and year-on-year percentage change). 120 10. 115 5. Year-on-year percentage change Volume index 2015=100. 110 0. 105 -5. 100 -10. 95 -15. 90 -20. 2019Q1. 2019Q3. 2019Q4. 2020Q1. 2015Q1. 2015Q2. 2015Q3. 2015Q4. 2016Q1. 2016Q2. 2016Q3. 2016Q4. 2017Q1. 2017Q2. 2017Q3. 2017Q4. 2018Q1. 2018Q2. 2018Q3. 2018Q4. 2019Q2. 2020Q2. 2020Q3. 2020Q4.
8 2021Q1. Year-on-year % change (right axis) Index, 2015Q1 = 100 (left axis). Sources: WTO Secretariat and UNCTAD. World merchandise trade volume fell by per cent in the 2019. By comparison, merchandise trade took more first quarter of 2020 compared with the previous quarter than two years to recover to its pre-crisis level after the and a further per cent in the second quarter. By the financial crisis. end of the second quarter, merchandise trade was down per cent compared to the same period in 2019. trade growth slowed to per cent in the first quarter of 2021 compared with the previous quarter while year- Merchandise trade jumped per cent in the third on-year growth picked up to per cent.
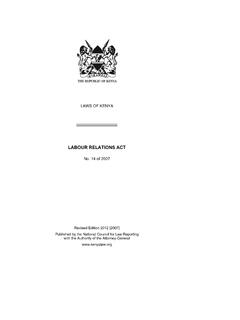
9 Year-on-year quarter of 2020 compared with the previous quarter and growth is expected to be very strong in the second another per cent in the final quarter, bringing the quarter of 2021, mostly due to the downturn in the second volume of trade back to its level in the fourth quarter of quarter of 2020. 23. World trade Statistical Review 2021. The recovery of merchandise trade since the third quarter of 2020 has been strong but uneven, with exports and imports growing faster in some regions than in others. Chart Merchandise exports by region, 2015Q1-2021Q1.
10 (Volume indices 2015Q1=100). Exports 140. 130. 120. Volume indices 2015Q1=100. 110. 100. 90. 80. 70. 2019Q4. 2019Q4. 2019Q4. 2020Q1. 2020Q2. 2020Q3. 2015Q1. 2020Q4. 2021Q1. 2015Q2. 2015Q3. 2015Q4. 2016Q1. 2016Q2. 2016Q3. 2016Q4. 2017Q1. 2017Q2. 2017Q3. 2018Q3. 2017Q4. 2018Q1. 2018Q2. 2018Q4. 2019Q1. 2019Q2. 2019Q3. 2019Q4. North America South America1 Europe CIS2 Africa Middle East Asia 1. Refers to South and Central America and the Caribbean. 2. Refers to Commonwealth of Independent States, including certain associate and former member States. Sources: WTO and UNCTAD.