Transcription of chApTEr Normal Values and Assessments
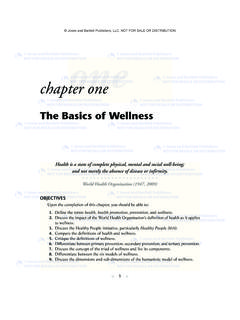
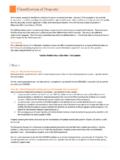
1 C h a p te r 1. Normal Values and Assessments ASIA classification of Spinal Cord Injury The American Spinal Injury Association (ASIA) has developed a spinal injury classification system based on specific motor and sensory Assessments as depicted in the figure on page 2. Motor function is determined by manual muscle testing of 10 key muscles. Results of manual muscle tests are expressed numerically. Dermatomal sensation assessment for pinprick and light touch is performed and scored numerically. The ASIA Impairment Scale, using letters A to E, represents the overall classification of the spinal injury. 1. 1 4/23/12 12:28:49 P.
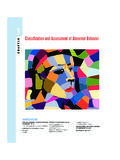
2 2 chApTEr 1 Normal Values and Assessments STANDARD NEUROLOGICAL classification OF. SPINAL CORD INJURY LIGHT. TOUCH P. R L R L R. C2 MOTOR C2. C3 Key muscles C3. C4 C4. C5 Elbow flexors C5. C6 Wrist extensors C6. C7 Elbow extensors C7. C8 Finger flexors (distal phalanx of middle finger) C8. T1 Finger abductors (little finger) T1. T2 T2. T3 0 = total paralysis T3. T4 1 = palpable or visible contraction T4. T5 2 = active movement, T5. T6 gravity eliminated T6. T7 3 = active movement, T7. T8 against gravity T8. 4 = active movement, T9 against some resistance T9. T10 5 = active movement, T10. T11 against full resistance T11.
3 T12 NT = not testable T12. L1 L1. L2 Hip flexors L2. L3 Knee extensors L3. L4 Ankle dorsiflexors L4. L5 Long toe extensors L5. S1 Ankle plantar flexors S1. S2 S2. S3 S3. S4-5 Voluntary anal contraction (Yes/No) S4-5. Totals Totals + = Motor score + =. (Maximum 50 50 100) (Maximum 56 56 5. NEUROLOGICAL Complete or incomplete? ZONE OF PARTIAL. LEVEL R L Incomplete = Any sensory or PRESERVATION. The most Sensory motor function in S4-S5 Caudal extent of partially caudal segment innervated segments with Normal Motor ASIA IMPAIRMENT. function SCALE. Figure Standard Neurological classification of Spinal Cord Injury Source: Reproduced with permission of the American Spinal Injury Association (2005).)
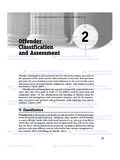
4 This form may be copied freely but should not be altered without permis . sion from the American Spinal Injury Association. 2 ASIA Standard Neurological classification of Spinal Cord Injury Chart4/23/12 12:28:50 P. ASIA classification of Spinal Cord Injury 3 ASSIFICATION OF SENSORY. LIGHT PIN Key sensory points TOUCH PRICK. R L R L 0 = absent TOR C2. 1 = impaired = Key 2 = Normal sensory uscles C3 NT = not testable C2 point C4. C3. C4. C5 C5. T2. T3. T2. C5. C6. T4. T5. T6. C7 T7. T8. halanx of middle finger) C8 C6. T1. T9. T10. T1. C6. finger) T1 T11. T12. Palm Palm T2 L1 L1. T3. ble contraction C8. T4. C8. Dorsum C6 L2 L2 C6.
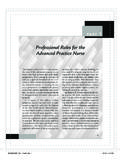
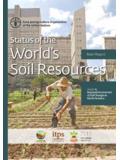
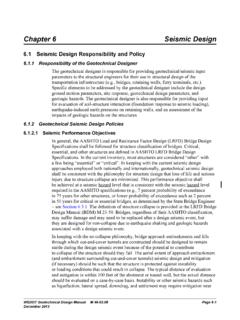
5 Nt, T5 C7. Dorsum C7. ed T6 L3 L3. nt, T7 S3 S3. T8 S4-5. nt, L4 L4. esistance T9 L5 L5. nt, T10 L2 L2. tance T11 S2. L3 L3. S2. T12 S1 S1. L1. S1. L2. L3 L4. C2. L4 S1 S1. L5. L5 L5. C3. S1 C4. S2. S3. ction (Yes/No) S4-5 Any anal sensation (Yes/No). Totals + = Pin prick score (Max 112). + = Light touch score (Max 112). (Maximum 56 56 56 56). plete or mplete? ZONE OF PARTIAL. plete = Any sensory or PRESERVATION R L. unction in S4-S5 Caudal extent of partially Sensory innervated segments IMPAIRMENT Motor LE. Figure continued tion of Spinal Cord Injury 3 Chart 4/23/12 12:28:50 P. 4 chApTEr 1 Normal Values and Assessments A = Complete: No motor or sensory function is preserved in the sacral segments S4 S5.
6 B = Incomplete: Sensory but not motor function is preserved below the neurological level and includes the sacral segments S4 S5. C = Incomplete: Motor function is preserved below the neurological level, and more than half of key muscles below the neurological level have a muscle grade less than 3. D = Incomplete: Motor function is preserved below the neurological level, and at least half of key muscles below the neurological level have a muscle grade of 3 or more. E = Normal : Motor and sensory function are Normal . Clinical Syndromes Central Cord Brown-S quard Anterior Cord Conus Medullaris Cauda Equina Figure ASIA Impairment Scale Source: Reproduced with permission of the American Spinal Injury Association (2005).
7 4 4/23/12 12:28:50 P. 5. Table Blood Complete Blood Count (CBC). Note: Normal Values may vary from one laboratory to another. The Values presented in these charts should not be considered absolute. Assessment Component Values Description/Implications/Red Flag Values Red Blood Cells (RBCs) (erythrocytes) Infants: Individuals with lower-than- Normal Values have anemia. million/mm3 Anemia symptoms: fatigue, weakness, SOB, dizziness, Children: tachycardia million/mm3 Individuals with higher-than- Normal Values have polycythemia. Men: Polycythemia symptoms: SOB, headache, dizziness, itchiness. million/mm3. Women: million/mm3.
8 Erythrocyte Sedimentation Children: 1 13 mm/h The ESR is the rate at which erythrocytes settle out of blood Rate (ESR/Sed. Rate) Men: 0 17 mm/h plasma in 1 hour. Women: 1 25 mm/h A high rate is indicative of infection or inflammation Hematocrit (HCT) Infants: 30 60% Hematocrit is the percent of whole blood composed of Children: 30 49% erythrocytes. Table Blood Complete Blood Count (CBC) Men: 37 49% Exercise may be restricted at Values of 25%. Women: 36 46%. 5 continues 4/23/12 12:28:50 P. 6. 6 Table Blood Complete Blood Count (CBC), continued Note: Normal Values may vary from one laboratory to another. The Values presented in these charts should not be considered absolute.
9 Assessment Component Values Description/Implications/Red Flag Values Hemoglobin (HGB) Infants: 17 19 g/dL HGB measures the oxygen-carrying capacity of RBCs. Low Children: 14 17 g/dL Values between 8 and 10 g/dL are associated with poor exercise Men: 13 18 g/dL tolerance, increased fatigue, and tachycardia. Women: 12 16 g/dL. Platelets Units: cells/mm3 Platelets play a key role in the initiation of the clotting process Infants: 200,000 within damaged blood vessels. 475,000 Exercise may be cautiously performed with Values of 21,000 . Children: 150,000 50,000 cells/mm3. 400,000 Exercise may be contraindicated at Values of 20,000 cells/mm3.
10 Adults: 150,000 400,000. chApTEr 1 Normal Values and Assessments White Blood Cells (WBCs) Units: cells/mm3 White blood cells play a crucial role in the body's immune Children: 4,500 14,500 reaction. Adults: 4,500 11,000 Exercise may not be permitted at Values of 5,000 cells/mm3. 4/23/12 12:28:50 P. 7. Differential WBC Count Neutrophils: The various white blood cells play different roles in the immune 1,800 7,000 cells/mm3 process. They exist in stereotypical proportions. Lymphocytes: 1,500 4,000 cells/mm3. Monocytes: 0 800 cells/mm3. Eosinophils: 0 450 cells/mm3. Basophils: 0 200 cells/mm3. Table Blood Complete Blood Count (CBC) 7 4/23/12 12:28:50 P.