Transcription of CHAPTER TWO The Wave Characteristic Method - …
1 CHAPTER TWO. The Wave Characteristic Method The WCM is based on the physically accurate concept that the transient pipe flow results from the generation and propagation of pressure waves that occur as a result of a disturbance in the pipe system (valve closure, pump trip, etc.). A. pressure wave, which represents a rapid pressure and associated flow change, travels at sonic velocity for the liquid-pipe medium, and the wave is partially transmitted and reflected at all discontinuities in the pipe system (pipe junctions, pumps, open or closed ends, surge tanks, etc). A pressure wave can also be modified by pipe wall resistance. This description is one that closely represents the actual mechanism of transient pipe flow. In this CHAPTER , relationships are presented for the magnitude and propagation velocity and attenuation of pressure waves , and for the effect of pressure waves impinging on piping system elements.
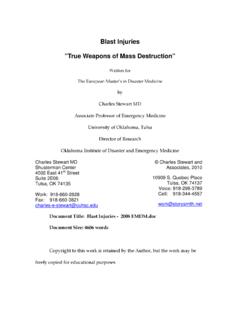
2 BASIC RELATIONS. The relationship between pressure change ( P ) and flow change ( Q ), which is associated with the passage of a pressure wave, defines the transient response of the pipe system and forms the basis for the development of the required mathematical expressions. Figure 2-1 depicts the flow and pressure conditions that exist a short time t apart, as a pressure wave of magnitude P propagates a distance x in a liquid filled pipe. Figure 2-1: Pressure wave propagation in a pipe. 2-2 CHAPTER TWO. During the short time t , the pressure on the left end of the liquid column is P + P while the right end of the liquid column is P . This unbalanced pressure causes the fluid to accelerate. The momentum principle gives (P + P P )AL = x Q (2-1). t where AL is the pipe cross sectional area; is the liquid density; and g is the acceleration of gravity. Canceling and rearranging gives x P = Q (2-2).
3 AL t The term x is the propagation speed of the pressure wave. The wave t speed is equal to the sonic (acoustic) velocity (c) in the system if the mean velocity of the liquid in the line is neglected. Since the mean velocity of the liquid is usually several orders of magnitude smaller than the sonic velocity, this is acceptable. Thus Q. P = c (2-3a). AL. or, in terms of pressure head Q. H = c (2-3b). gAL. This relation was first presented by Joukowsky (1904). The sonic speed c for a liquid flowing within a line is influenced by the elasticity of the line wall. For a pipe system with some degree of axial restraint a good approximation for the wave propagation speed is obtained using c = E f / (1 + K R E f D / E c t l ) (2-4). where E f and E c are the elastic modulus of the fluid and conduit, respectively; D is the pipe diameter; t l is the pipe thickness; and K R is the coefficient of restraint for longitudinal pipe movement.
4 Typically, three types of pipeline support are considered for restraint. These are: Case a: The pipeline is restrained at the upstream end only. THE WAVE Characteristic Method 2-3. KR = 1 p / 2 (2-5a). Case b: The pipeline is restrained throughout. K R = 1 P2 (2-5b). Case c: The pipeline is unrestrained (has expansion joints throughout). KR = 1 (2-5c). where P is the Poisson's ratio for the pipe material. For thick-walled pipes, the values of the restraint coefficient for the three types of pipeline support are: Case a: The pipeline is restrained at the upstream end only. D 2t KR = (1 p / 2) + l (1 + ) (2-6a). D + tl D. Case b: The pipeline is restrained throughout. D 2t KR = (1 P2 ) + l (1 + ) (2-6b). D + tl D. Case c: The pipeline is unrestrained (has expansion joints throughout). D 2t KR = + l (1 + ) (2-6c). D + tl D. Table 2-1: Physical properties of common pipe materials. Material Young's Modulus Poisson's Ratio Ec (GPa) p Aluminum 69 Asbestos Cement 23-24 - Cast Iron 80-170 Concrete 14-30 Reinforced Concrete 30-60 - Ductile Iron 172 Polyethylene PVC Steel 200-207 2-4 CHAPTER TWO.
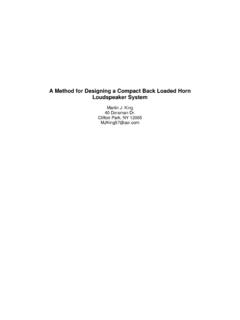
5 Figure 2-2: Pressure wave velocity for water in round pipes with different diameters and thicknesses and KR equal to (adapted from Thorley, 1991). THE WAVE Characteristic Method 2-5. Table 2-1 lists physical properties of common pipe materials. These values should assist in calculating wave speeds in pipes constructed of common materials. A plot of wave propagation speeds for water flowing in a circular pipe subjected to a representative pipeline restraint for a variety of materials is shown in Figure 2-2 (Thorley, 1991), although the values for thick walled pipes ( , for small values on the abscissa) must be taken as approximate only. For the majority of hydraulic analyses involving transients, the wave speed can be considered to be constant. It is important to note that gas dissolved in the liquid can significantly affect the wave speed. In fact, the presence of even small quantities of air can significantly reduce the wave propagation speed of water in pipes.
6 At higher pressures the effect of the trapped air decreases. In very rigid pipes, in tanks, or in large water bodies, the acoustic velocity Ef is reduced to c =.. For circular section tunnels, the coefficient of restraint for all three cases above reduces to (Thorley, 1991). 2t l KR = (1 + ) (2-7). D. Exercise Wave Speed Calculate the wave speed for the three restraints with the following conditions: Steel Schedule 10 - 6 inch pipe Inside diameter = inches Outside diameter = inches Modulus of steel = 30,000,000 psi Modulus of water = 300,000 psi Poisson ratio = Answers: Expansion joints throughout 3,960 ft/s Anchored at upstream end only 4,056 ft/s Anchored throughout 4,013 ft/s The Wave Speed tool ( ) shown below can be used to make the above calculations. Check the above answers using this tool, which is discussed in Appendix 2-6 CHAPTER TWO. THE WAVE Characteristic Method . Pressure waves are generated at any point in a pipe system where a disturbance that results in a change in flow rate is introduced.
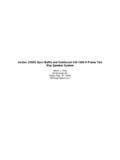
7 This can include a valve that is opening or closing, a pump that is started up or shut down, a change in a reservoir pressure, or a change in an inflow or outflow for the system. Pressure and flow conditions at a component are also affected by the impinging pressure waves . This pressure wave tracking approach to transient analysis forms the basis of the Wave Characteristic Method and is illustrated using the sequence of transient events shown in Figure 2-3. For the first transient event, a valve closes and a pressure wave is generated. For the second event, the pressure wave travels toward the 3-pipe junction at sonic speed in the pipe. For the third event, the wave is transmitted into the two connecting (outgoing) pipes and reflected back into the original pipe producing three new pressure waves . For the fourth event, each pressure wave travels at sonic speed toward the opposite end of the pipe and impinges on the elements at those locations.
8 For the last event, the THE WAVE Characteristic Method 2-7. pressure waves modify conditions at the reservoir, valve, and pump and new pressure waves are generated and travel back toward the 3-pipe junction. Note: the pressure wave actions depicted at the opposite ends (4-5) will normally occur separately at the instant when each wave reaches the element located at that end. Figure 2-3: Pressure waves generated following an instantaneous valve closure. 2-8 CHAPTER TWO. This approach to transient analysis requires the calculation of the effects of pressure waves impinging on pipe junctions, components ( , valves and pumps) and surge control elements which inject or remove fluid ( , surge tanks and air/vacuum valves) as well as calculating the effect of line friction on the magnitude of pressure waves . These pressure wave action calculations are illustrated in Figure 2-4 and discussed in detail in the following sections.
9 Graphical tools are also provided that allow the reader to better understand the phenomena of pressure wave propagation and the calculations required to incorporate their effects on pressures and flows throughout a piping system. Surge Control Device Junction Component Effect of Friction Figure 2-4: Pressure wave action at network discontinuities. ILLUSTRATING THE WAVE Characteristic Method . The Wave Characteristic Method consists of essentially tracking with time the propagation and attenuation of pressure waves that are moving at sonic speed, and calculation of their effects on the pressures and flows (in both time and THE WAVE Characteristic Method 2-9. space) throughout the water distribution piping system. It represents the pipe system as a connected graph composed of a finite number of discontinuities connected by frictionless pipe segments, which serve only to transmit pressure waves .
10 Starting at an initial steady-state flow condition, the tracking mechanism is initiated after a disturbance is introduced at a given point in the pipe system ( , closing of a valve). The disturbance produces an incremental change in the volumetric flow rate, which then results in a transient pressure wave ( H ) that is introduced at that location. This pressure wave travels throughout the pipe network at sonic speed, and is partly reflected and transmitted at all physical and geometrical discontinuities. Temporal variations of pressures and flows (velocities) are then computed for any point in the pipe system by summing with time the contributions of impinging pressure waves . The effects of line friction (or viscous resistance) influence the propagation of pressure waves and are simulated using the orifice analogy . They are modeled as square-law friction orifices (or artificial discontinuities) with properly chosen orifice coefficients.