Transcription of Charting the labor market: Data from the Current ...
1 1 BUREAUOFLABORSTATISTICS the labor market: Data from the Current Population Survey (CPS)February 2, 20182 BUREAUOFLABORSTATISTICS of labor labor force participation wage and salary self-employed, workers as a percent of total part time for economic unemployment of unemployed as a percent of total for losers by layoff status3 BUREAUOFLABORSTATISTICS of contents rates for adult men, adult women, and rates by race and Hispanic or Latino rates for persons 25 years and older by educational not in the labor force who want a not in the labor force.
2 Selected measures of labor underutilizationAdditional information available in The Employment Situation news Browse labor force concepts and data by 4 BUREAUOFLABORSTATISTICS BUREAUOFLABORSTATISTICS 1. Civilian labor force Seasonally adjusted, 1990 2018115,000120,000125,000130,000135,0001 40,000145,000150,000155,000160,000165,00 0199019921994199619982000200220042006200 820102012201420162018115,000120,000125,0 00130,000135,000140,000145,000150,000155 ,000160,000165,000 Numbers in thousandsNote: Shaded areas represent recessions as determined by the National Bureau of Economic Research (NBER).
3 Data online at BUREAUOFLABORSTATISTICS BUREAUOFLABORSTATISTICS 2. Civilian labor force participation rateSeasonally adjusted, 1990 : Shaded areas represent recessions as determined by the National Bureau of Economic Research (NBER). Data online at 2018 percent6 BUREAUOFLABORSTATISTICS BUREAUOFLABORSTATISTICS 3. Civilian employmentSeasonally adjusted, 1990 2018115,000120,000125,000130,000135,0001 40,000145,000150,000155,000160,000199019 9219941996199820002002200420062008201020 12201420162018115,000120,000125,000130,0 00135,000140,000145,000150,000155,000160 ,000 Numbers in thousandsNote: Shaded areas represent recessions as determined by the National Bureau of Economic Research (NBER).
4 Data online at BUREAUOFLABORSTATISTICS BUREAUOFLABORSTATISTICS 4. Employment-population ratioSeasonally adjusted, 1990 : Shaded areas represent recessions as determined by the National Bureau of Economic Research (NBER). Data online at percentPercent8 BUREAUOFLABORSTATISTICS BUREAUOFLABORSTATISTICS 5. Nonagricultural wage and salary employmentSeasonally adjusted, 1990 2018100,000105,000110,000115,000120,0001 25,000130,000135,000140,000145,000150,00 0199019921994199619982000200220042006200 820102012201420162018100,000105,000110,0 00115,000120,000125,000130,000135,000140 ,000145,000150,000 Numbers in thousandsNote: Shaded areas represent recessions as determined by the National Bureau of Economic Research (NBER).
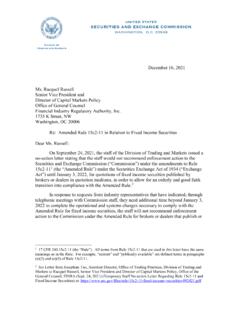
5 Data online at BUREAUOFLABORSTATISTICS BUREAUOFLABORSTATISTICS 6. Nonagricultural self-employed, unincorporated Seasonally adjusted, 1990 20187,5008,0008,5009,0009,50010,00010,50 0199019921994199619982000200220042006200 8201020122014201620187,5008,0008,5009,00 09,50010,00010,500 Note: Shaded areas represent recessions as determined by the National Bureau of Economic Research (NBER). Data online at in thousands10 BUREAUOFLABORSTATISTICS BUREAUOFLABORSTATISTICS 7. Part-time workers as a percent of total employedSeasonally adjusted, 1990 : Shaded areas represent recessions as determined by the National Bureau of Economic Research (NBER).
6 Beginning in 1994, data reflect the introduction of a major redesign of the Current Population Survey. Data online at BUREAUOFLABORSTATISTICS BUREAUOFLABORSTATISTICS 8. Employed part time for economic reasonsSeasonally adjusted, 1990 201801,0002,0003,0004,0005,0006,0007,000 8,0009,00010,000199019921994199619982000 20022004200620082010201220142016201801,0 002,0003,0004,0005,0006,0007,0008,0009,0 0010,000 Numbers in thousandsNote: Shaded areas represent recessions as determined by the National Bureau of Economic Research (NBER). Beginning in 1994, data reflect the introduction of a major redesign of the Current Population Survey.
7 Data online at BUREAUOFLABORSTATISTICS BUREAUOFLABORSTATISTICS 9. Civilian unemploymentSeasonally adjusted, 1990 201802,0004,0006,0008,00010,00012,00014, 00016,0001990199219941996199820002002200 4200620082010201220142016201802,0004,000 6,0008,00010,00012,00014,00016,000 Numbers in thousandsNote: Shaded areas represent recessions as determined by the National Bureau of Economic Research (NBER). Data online at BUREAUOFLABORSTATISTICS BUREAUOFLABORSTATISTICS 10. Civilian unemployment rateSeasonally adjusted, 1990 : Shaded areas represent recessions as determined by the National Bureau of Economic Research (NBER).
8 Data online at percentPercent14 BUREAUOFLABORSTATISTICS BUREAUOFLABORSTATISTICS 11. Duration of unemploymentSeasonally adjusted, 1990 201801,0002,0003,0004,0005,0006,0007,000 1990199219941996199820002002200420062008 2010201220142016201801,0002,0003,0004,00 05,0006,0007,000 Numbers in thousandsNote: Shaded areas represent recessions as determined by the National Bureau of Economic Research (NBER). Data online at weeks and overLess than 5 weeks5 to 14 weeks15 to 26 weeks15 BUREAUOFLABORSTATISTICS BUREAUOFLABORSTATISTICS 12.
9 Long-term unemployed as a percent of total unemployedSeasonally adjusted, 1990 : Shaded areas represent recessions as determined by the National Bureau of Economic Research (NBER). Data online at unemployed 27 weeks and overPercent16 BUREAUOFLABORSTATISTICS BUREAUOFLABORSTATISTICS 13. Reasons for unemploymentSeasonally adjusted, 1990 201801,0002,0003,0004,0005,0006,0007,000 8,0009,00010,00011,000199019921994199619 9820002002200420062008201020122014201620 1801,0002,0003,0004,0005,0006,0007,0008, 0009,00010,00011,000 Note: Shaded areas represent recessions as determined by the National Bureau of Economic Research (NBER).
10 Data online at losersNew entrantsJob leaversReentrantsNumbers in thousands17 BUREAUOFLABORSTATISTICS BUREAUOFLABORSTATISTICS 14. Job losers by layoff statusSeasonally adjusted, 1990 201801,0002,0003,0004,0005,0006,0007,000 8,0009,000199019921994199619982000200220 04200620082010201220142016201801,0002,00 03,0004,0005,0006,0007,0008,0009,000 Numbers in thousandsNote: Shaded areas represent recessions as determined by the National Bureau of Economic Research (NBER). Data online at on temporary layoffOn temporary layoff18 BUREAUOFLABORSTATISTICS BUREAUOFLABORSTATISTICS 15.