Transcription of Child Maltreatment 2019: Summary of Key Findings
1 1 This factsheet presents data from Child Maltreatment 2019, a report based on data submissions by State Child protective services (CPS) agencies for Federal fiscal year (FFY) 2019. The full Child Maltreatment 2019 report is available on the Children s Bureau website. The report includes comparison statistics for the last 5 years. These statistics indicate an increase in the overall rates of Child victimization as well as an increase in the overall rates of children who received a response from a CPS voluntarily provide data on Child abuse and neglect to the National Child Abuse and Neglect Data System (NCANDS) that are used for the annual Child Maltreatment report . States have their own definitions of Child abuse and neglect based on standards set by Federal Additionally, States screening policies and responses to Maltreatment may differ, as does what each State reports to NCANDS.
2 1 For more information about State definitions, refer to Child Welfare Information Gateway s Definitions of Child Abuse and Neglect. NUMBERS AND TRENDS | APRIL 2021 Children s Bureau/ACYF/ACF/HHS | | | : Maltreatment 2019: Summary of Key FindingsWHAT'S INSIDEWhat were the most common types of Maltreatment ?How many allegations of Maltreatment were reported and investigated?Who reported Child Maltreatment ?Who were the Child victims?How many children died from abuse or neglect?Who abused and neglected children?Who received services, and what did they include?Children s Bureau/ACYF/ACF/HHS | | Email: | MANY ALLEGATIONS OF Maltreatment WERE REPORTED AND INVESTIGATED?During FFY 2019, CPS agencies received an estimated million referrals involving the alleged Maltreatment of approximately million The national referral rate is referrals per 1,000 children in the population.
3 Of these referrals, approximately million reports concerning approximately million children were screened in as appropriate for CPS response and received either an investigation or alternative The national rate for children receiving either an investigation or alternative response was children per 1,000 in the than half ( percent) of referrals were screened in for investigation or assessment by CPS agencies in the 45 States that reported statistics for both screened-in and screened-out reports. Approximately one-fifth ( percent) of the children investigated were found to be victims of abuse or neglect a rate of per 1,000 children in the population. The remainder of the children investigated ( percent) were found to be nonvictims of Maltreatment or received an alternative response.
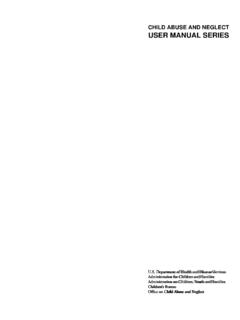
4 The following, also illustrated in figure 1, are additional details about the dispositions of the investigations (duplicate count):4 percent substantiated percent indicated percent unsubstantiated percent no alleged Maltreatment percent alternative response5 percent closed with no finding percent other percent unknown percent intentionally millionDuring FFY 2019, CPS agencies received an estimated million referrals involving the alleged Maltreatment of approximately million %Alternative %No alleged %Closed with no % % 1. INVESTIGATION DISPOSITIONS2 Over time, the Child Maltreatment report series has transitioned from using duplicate counts to unique counts for most analyses. For example, a duplicate count of Child victims counts a Child each time he or she was found to be a victim, while a unique count of Child victims counts a Child only once, regardless of the number of times he or she was found to be a victim during the reporting year.
5 All numbers provided here are unique counts, unless noted otherwise. 3 Alternative response is the provision of a response other than an investigation that determines whether a Child or family needs services. In alternative responses, a determination of Maltreatment is not made, and a perpetrator is not determined. 4 For definitions of these types of dispositions, refer to the glossary (appendix B) in Child Maltreatment 2019. 5 Beginning with Child Maltreatment 2015, children reported to NCANDS as alternative response victims or alternative response nonvictims are presented in one category, regardless of victim s Bureau/ACYF/ACF/HHS | | Email: | REPORTED Child Maltreatment ?For FFY 2019, more than two-thirds ( percent) of all reports of alleged Child abuse or neglect were made by professionals.
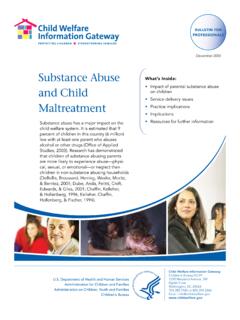
6 The term professional means that the person who was the source of the report had contact with the alleged Child Maltreatment victim as part of his or her job. The most common professional report sources were education personnel ( percent), legal and law enforcement personnel ( percent), medical personnel ( percent), and social services staff ( percent). Professional reporters also included foster care providers ( percent) and Child daycare providers ( percent). The remaining reports were made by nonprofessionals ( percent), such as friends, neighbors, and relatives, or by unclassified reporters ( percent), a category that includes anonymous and unknown WERE THE Child VICTIMS?In FFY 2019, an estimated 656,000 children were victims of abuse or neglect nationwide, which is a rate of victims per 1,000 children in the population.
7 The following is additional information about children confirmed as victims by CPS agencies in FFY 2019: Children in the age group of birth to 1 year had the highest rate of victimization at per 1,000 children of the same age in the national population. The rate declines as children s ages increase. Based on data from 49 States, nearly three-fourths ( percent) of victims were first-time victims. This equates to a rate of first-time victims per 1,000 children in the population. Slightly more than one-half ( percent) of all Child victims were girls, and percent were boys. The gender was unknown for percent of victims. Most victims were from three races or ethnicities:6 White ( percent), Hispanic ( percent), and African American ( percent).
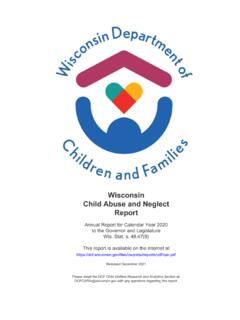
8 American Indian or Alaska Native children had the highest rates of victimization at per 1,000 children in the population of the same race or ethnicity, and African American children had the second-highest rate at per 1,000 children of the same race or ethnicity. 6 All races exclude children of Hispanic origin. Children of Hispanic ethnicity may be any Maltreatment ReportersMental health personnelEducation personnelLegal and law enforcementMedical personnelSocial services staffNonprofessionalsUnclassified s Bureau/ACYF/ACF/HHS | | Email: | % % % % %Other maltreatment01020304050607080 WHAT WERE THE MOST COMMON TYPES OF Maltreatment ?As in previous years, neglect was overwhelmingly the most common form of Child Maltreatment (see figure 2).
9 CPS investigations determined the following:7 percent of victims suffered neglect. percent of victims suffered physical abuse. percent of victims suffered sexual abuse. percent of victims suffered psychological Maltreatment . percent of victims suffered medical neglect. percent of victims experienced "other" Maltreatment , which may include threatened abuse or parental substance use. States define "other" differently, but it generally refers to any Maltreatment that does not fit in one of the NCANDS categories. FIGURE 2. TYPES OF MALTREATMENT7 If a victim is reported with two or more different Maltreatment types, the victim is counted in multiple Maltreatment -type categories. A victim is counted once for each substantiated Maltreatment type, but only a maximum of once per s Bureau/ACYF/ACF/HHS | | Email: | s Bureau/ACYF/ACF/HHS | | Email: | MANY CHILDREN DIED FROM ABUSE OR NEGLECT?
10 NCANDS defines " Child fatality" as the death of a Child caused by an injury resulting from abuse or neglect or where abuse or neglect was a contributing factor. The following are data regarding Child fatalities due to Child Maltreatment during FFY 2019: An estimated 1,840 children died due to abuse or neglect. The overall rate of Child fatalities was deaths per 100,000 children in the national population. Nearly three-quarters ( percent) of the children who died due to Child abuse or neglect were younger than 3 years old. Of the children who died, percent suffered neglect, and percent suffered physical abuse. Since children may have suffered from more than one type of Maltreatment , the total percentage of the reported types of Maltreatment exceeds 100 percent.