Transcription of Child Poverty and Adult Success - Urban Institute
1 Caroline Ratcliffe September 2015 Low-income children caught up in their parents economic struggles experience the impact through unmet needs, low-quality schools, and unstable circumstances. Children as a group are disproportionately poor: roughly one in five live in Poverty compared with one in eight adults (US Census Bureau 2014). What does the long-term picture look like for children? How does it look for ever-poor children those who are poor for at least one year before their 18th birthday? Following children from birth through age 17 shows a much greater prevalence of Poverty than the annual figures would suggest.
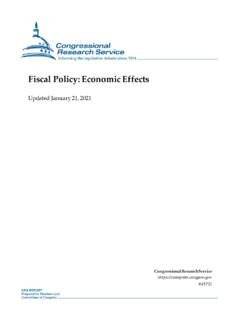
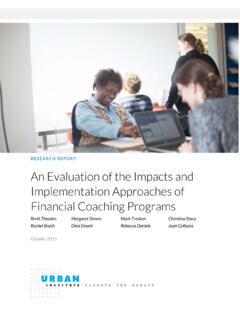
2 Four of every 10 children ( percent) are poor for at least one year before they reach their 18th birthday (figure 1). Black children fare much worse: fully three-quarters ( percent) are poor during childhood. The number for white children is substantial, yet considerably lower ( percent). Persistent childhood Poverty living below the federal Poverty level for at least half of one s childhood is also prevalent, particularly among black Among all children, 1 in 10 ( percent) is persistently poor. For black children this number is roughly 4 in 10 ( percent), and for white children it s fewer than 1 in 10 children ( percent).
3 2 Many of these children struggle academically, do not complete high school, and have spotty employment as young adults (Ratcliffe and McKernan 2010, 2012). But not all poor children have poor young Adult outcomes. Two important questions are why some children succeed and what factors seem to help them do so (or at least do not hold them back). L O W-I N C O M E W O R K I N G F A M I LI E S I N I T I A T I V E Child Poverty and Adult Success 2 C H I L D P O V E R T Y A N D A DU L T S U C C E S S FIGURE 1 Percentage of Childhood Poor, by Race Source: Author s tabulation of PSID data.
4 Notes: Tabulations are weighted and include children born between 1968 and 1989. Persistently poor children are poor at least half the years from birth through age 17. Ever-poor, nonpersistently children are poor at least one year, but less than half the years, from birth through age 17. The analysis begins by looking at all children but then narrows to concentrate on ever-poor children. Regression models examine how childhood experiences and family and neighborhood characteristics relate to children s Adult Success as measured by completing high school by age 20, enrolling in postsecondary education (college or certificate program) by age 25, completing a four-year college degree by age 25, and being consistently employed in young adulthood (ages 25 through 30).
5 Potential impediments to educational achievement and employment, specifically teenage nonmarital childbearing and involvement in the criminal justice system (as measured by being arrested by age 20) are also examined. These analyses are based on over 40 years of data (1968 2009) from the Panel Study of Income Dynamics (PSID). The findings suggest the following: The future achievement of ever-poor children is related to the length of time they live in Poverty . Persistently poor children are 13 percent less likely to complete high school and 43 percent less likely to complete college than those who are poor but not persistently poor as children.
6 All childrenWhite childrenBlack childrenNever poorEver poor, not persistently poorPersistently C H I L D P O V E R T Y A N D A DU L T S U C C E S S 3 Parental education is closely related to the academic achievement of ever-poor children. Compared with ever-poor children whose parents do not have a high school education, ever-poor children whose parents have a high school education or more than a high school education are 11 and 30 percent, respectively, more likely to complete high school. Residential instability is related to lower academic achievement for ever-poor children.
7 Ever-poor children who move three or more times for negative reasons before they turn 18 are 15 percent less likely to complete high school, 36 percent less likely to enroll in college or another postsecondary education program by age 25, and 68 percent less likely to complete a four-year college degree by age 25 than ever-poor children who never move. Living in a multigenerational household does not improve outcomes for ever-poor children. However, persistently poor children in multigenerational households are more likely to complete high school, enroll in postsecondary education, and complete college.
8 What Matters for Children? Adult achievement is related to childhood Poverty and the length of time they live in Poverty . Children who are poor are less likely to achieve important Adult milestones, such as graduating from high school and enrolling in and completing college, than children who are never poor. For example, although more than 9 in 10 never-poor children ( percent) complete high school, only 3 in 4 ever-poor children ( percent) do so (table 1). TABLE 1 Educational Achievement, Employment, Nonmarital Childbearing, and Criminal Justice Involvement by Childhood Poverty Status (percent) Never poor Ever poor Among Ever Poor Not persistently poor Persistently poor Educational attainment High school diploma by age 20 ** ** Postsecondary enrollment by age 25 ** ** Completed college by age 25 ** ** Consistently employed ages 25 30 ** ** No premarital teen birth ** ** Never arrested by age 20 ** Source: Author s tabulation of PSID data.
9 Notes: Tabulations are weighted and include children born between 1968 and 1989. Statistical significance for the never poor and ever poor data columns is based on the difference between individuals who are never poor and those who are ever poor in childhood. Significance for the not persistently poor and persistently poor data columns is based on the difference between individuals who are ever poor but not persistently poor and those who are persistently poor in childhood. *p < **p < **p < 4 C H I L D P O V E R T Y A N D A DU L T S U C C E S S When looking at the subset of children who experience Poverty ( , ever-poor children), large differences emerge between children who are and are not persistently poor.
10 Specifically, academic achievement, employment, and the likelihood of no teen childbearing are lower for persistently poor children than for nonpersistently poor children. Although 64 percent of persistently poor children complete high school, 83 percent of nonpersistently poor children do so a difference of roughly20 percentage points. Time spent living in Poverty matters even after controlling for a host of family- and neighborhood-level ( , census tract) characteristics in regression models. These models also include race/ethnicity, gender, parental educational attainment at birth, whether and the number of times the family moves for a negative reason ( , housing unit coming down, being evicted, divorce, to pay lower rent),3 and mother s age at birth, as well as the percentage of childhood spent living in a female-headed family, a multigenerational family, a disabled-headed family, a metropolitan area, and the South.


![Agreement For Trainee Position At [Company Name]](/cache/preview/c/2/a/d/9/f/b/6/thumb-c2ad9fb6d6fbc41727ddd0774ce62d01.jpg)