Transcription of CHILDREN IN AFRICA - UNICEF DATA
1 UNICEF /ETHA_2014_00248/OsePrepared by: UNICEF Data & AnalyticsDivision of Data, Research and PolicyNovember 2015 Find the latest statistics on CHILDREN in AFRICA at the UNICEF Statistics website: Number of births, by UNICEF region, 1950-2050 Source: UNICEF analysis based on the United Nations, Department of Economic and Social Affairs, Population Division, World Population Prospects: The 2015 Revision, United Nations, New York, 2015 Notes: (1) Maps in this brochure are stylized and not to scale. They do not reflect a position by UNICEF on the legal status of any country or territory or the deliminatation of any frontiers. The final boundary between the Republic of the Sudan and the Republic of South Sudan has not yet been determined. (2) Regional aggregates are calculated according to the regional classification of the African Union, unless otherwise noted.
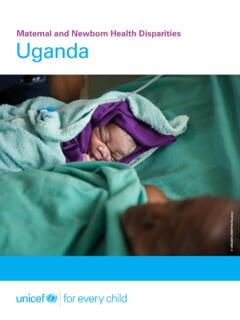
2 From 2015 onwards, sub-Saharan AFRICA is the region with the highest number of births, and this trend will persist for the rest of the century. By mid-century sub-Saharan AFRICA will account for 38 per cent of all births. Between 2015 and 2030 the number of CHILDREN under 18 in sub-Saharan AFRICA will rise from 496 million to 661 million. From 2026 onwards sub-Saharan AFRICA will be the single region with the greatest number of CHILDREN under child population in AFRICA is burgeoning; by 2050, more than 1 in 3 CHILDREN in the world will live in sub-Saharan AfricaKEY STATISTICS In AFRICA , mortality rates among CHILDREN under five decreased by 54 per cent between 1990 and 2015, but still half of the world's million under- five deaths occur in AFRICA . Pneumonia, malaria and diarrhoea account for 36% of all under- five deaths in AFRICA .
3 AFRICA has the highest rate of stunting among under-fives; it is also the region with slowest progress in reducing stunting since 1990. In 2014, there were an estimated million CHILDREN under 15 years living with HIV in AFRICA . Over half of the world s out-of-school CHILDREN (33 million) live in AFRICA . The population in AFRICA with access to an improved drinking source more than doubled from 1990 to 2015. There has been major progress in the last decade in the use of insecticide-treated nets among IN AFRICAKey statistics on child survival, protection and development60402001950197019902010203020 50 Births (millions)CEE/CISE astern and Southern AfricaMiddle East and North AfricaSub-Saharan AricaEast Asia and PacificLatin America and CaribbeanSouth AsiaOtherWest and Central AfricaKEY FACTIn AFRICA , mortality rates among CHILDREN under five (U5MR)
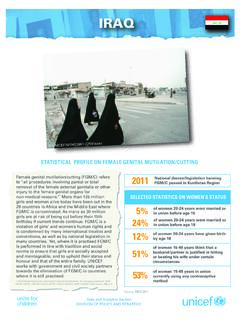
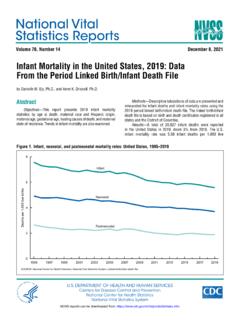
4 Have decreased by 54 per cent from 164 deaths per 1,000 live births in 1990 to 76 in 2015, but still half of the world's million under- five deaths occur in , almost half of all under- five deaths are attributable to malnutritionAll regions in AFRICA have experienced marked declines in under- five mortality since 1990 Pneumonia, malaria and diarrhoea account for 36% of all under- five deaths in AfricaDistribution of under- five deaths in AFRICA by cause, 2015 Despite declining rates, neonatal deaths are growing as a share of under- five deaths, amid faster progress in reducing mortality from 1 to 59 monthsAge distribution of under- five deaths, AFRICA , 1990-2015 CHILD mortality IN AFRICAS ource for all charts: UNICEF analysis based on UN IGME 2015 and WHO and Maternal and Child Epidemiology Estimation Group (MCEE) provisional estimates 2015 Under- five mortality rate by country (deaths per 1,000 live births) and number of under five deaths by sub-region, 2015 Under- five mortality rate, 1990-2015 25>25 50>50 75>75 100>100 Data not available Northern AFRICA 125,000 Western AFRICA 1,285,000 Eastern Africa697,000 Central AFRICA 529,000 Southern AFRICA 424,000 Northern AfricaSouthern AfricaEastern AfricaWestern AfricaCentral AfricaAfricaWorld05010020015025019901995 2000201020152005199020157416915320717599 16476914326608298 Child deaths(ages 1 to 4)Neonatal deaths(first month)27%36%Post-neonatal under- five deaths(1-11 months)Pneumonia (post-neonatal) (14%)Pneumonia (neonatal) (2%)Other post-neonatal (13%)
5 Intrapartum-relatedcomplications (post-neonatal) (1%)Measles (1%)AIDS (3%)Congenital abnormalities (post-neonatal) (3%)Meningitis (2%)Preterm birth complications (post-neonatal) (2%)Injuries (6%)Malaria (10%)Diarrhoea (post-neonatal) (10%)Diarrhoea (neonatal) (0%)Congenital abnormalities (neonatal) (3%)Other (neonatal) (2%)Tetanus (1%)Sepsis (6%)Intrapartum-related complications (neonatal) (10%)Preterm birth complications (11%)Pneumonia (17%)Neonatal (36%)Malaria (10%)Diarrhoea (10%)All other causes of death (31%)CHILD NUTRITION IN AFRICAS ource for bottom charts: UNICEF global databases 2015, based on DHS, MICS, and other national surveys; UNICEF , WHO, World Bank Group Joint Malnutrition Estimates, 2015 Edition. Note: *Some exceptions for earlier data years were made to ensure adequate population coverage for all : UNICEF , WHO, World Bank Group joint malnutrition estimates 2015 : UNICEF , WHO, World Bank Group joint malnutrition estimates 2015 FACTS Stunting, or being too short for one s age, is linked with irreversible long term consequences; it diminishes chances of succeeding in school and of living healthy and productive lives.
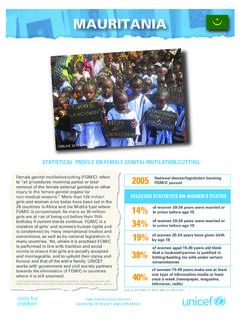
6 AFRICA is the only region with very little change in the percentage (%) of stunted CHILDREN since 1990. There are stark disparities between the richest and poorest in most sub-regions. Less than two-fifths of 0-5 month olds in AFRICA are exclusively breastfed; but rapid progress is possible as evidenced in many has seen slow progress in reducing stuntingPercentage of CHILDREN under 5 stunted, by United Nations region, 1990 2014 Recent advances in 6 African countries show that rapid progress in exclusive breastfeeding is possiblePercentage of infants 0-5 months who are exclusively breastfed, 2005-2012 Well-performing countries Recent and significant increases (> 15 percentage points)AsiaLatin Americaand CaribbeanAfricaGlobal100806020400 Niger('08, '10, '12)Burkina Faso('09, '12, '14)Togo('06, '10, '14)Sierra Leone ('08, '10, '14)Guinea Bissau('06, '10,'14)Burundi('05, '10)
7 113858451638273232506269532341628 Southern Africa6030400501020 Western AfricaCentral AfricaEastern AfricaNorthern AfricaGapRichest quintilePoorest quintileStunting rates are on average nearly twice as high among the poorestPercentage of CHILDREN under age five stunted (moderate and severe), by wealth quintile, 2009-2013*48284747462920261825In AFRICA , the number of stunted CHILDREN is risingNumber of CHILDREN under 5 stunted, by United Nations region, 1990 and 2014250200150501000 AsiaAfricaLatin America and CaribbeanGlobal300 Number (Millions)1990201419091-52%-55%+23%-38%4 725514581596 1990199520002005201020141990199520002005 2010201419901995200020052010201419901995 2000200520102014603040050102070-47%-24%- 52%-40% 4842254025321224 Western AfricaEastern AfricaNorthern AfricaSouthern AfricaEastern AfricaWestern AfricaCentral AfricaCentral AfricaAfricaAfricaSouthern AfricaNorthern AfricaWorldWorld1008060204005291435275 MATERNAL HEALTH IN AFRICAIMPROVEMENT IN MATERNAL HEALTH OUTCOMES REQUIRES KEY INTERVENTIONS.
8 A minimum of four visits for quality antenatal care in order to ensure the well-being of the mother and the baby Quality intra- and post-partum care with skilled health personnel Improved access to emergency obstetric care Expanded access to information, counseling and supplies for a wide range of contraceptive methods Antiretroviral therapy to all pregnant women who need it In malaria endemic countries, provision of intermittent preventive treatment of malaria and ITNs to all pregnant women during antenatal visitsMost pregnant women access skilled antenatal care at least once, but only about half receive the recommended minimum of four antenatal care visitsAntenatal care: Percentage of women aged 15-49 years attended at least once during pregnancy by skilled health personnel (doctor, nurse or midwife), and percentage attended by any provider at least four times 2010-2015*Skilled delivery care coverage is higher in urban than in rural areasSkilled attendance at birth: Percentage of births attended by skilled health personnel by area of residence, 2010-2015* About half of all births in AFRICA are assisted by skilled health personnelSkilled attendance at birth.
9 Percentage of births attended by skilled health personnel, 2010-2015 AFRICA has the highest number of maternal deaths, despite steady declines since 1990 Globally, the maternal mortality ratio (MMR) declined from 385 maternal deaths per 100,000 live births in 1990 to 216 in 2015 In sub-Saharan AFRICA the MMR was 546 per 100,000 live births in 2015, a 45% decline from 987 in 1990. Sub-Saharan AFRICA accounted for 201,000 maternal deaths in 2015, 66 per cent of the global total, largely due to limited access to emergency obstetric care and insufficient maternal care during pregnancy and : The World estimate for ANC 4 excludes China, for which comparable data are not for all charts: UNICEF global databases 2015, based on DHS, MICS, and other national surveys. <30%31-49%50-69%70-89%>90%Data not available% births attended by skilled health personnel100806020400 UrbanRural713341808864599097898347618973 844794557961 ANC 1 ANC 48578 CHILD MARRIAGE, BIRTH REGISTRATION AND FEMALE GENITAL MUTILATION/CUTTING (FGM/C) IN AFRICAS ource for all charts: UNICEF global databases 2015, based on DHS, MICS, other national surveys, censuses and vital registration systems.
10 Countries with high levels of child marriage tend to have high levels of early childbearingPercentage of women aged 20-24 years who were first married or in union before age 18, and who gave birth before age 18, African countries, 2005-2013 A third of young women in AFRICA were married or in union before age 18 Percentage of women aged 20-24 years who were first married or in union before age 18, 2003-2014 Above 80%51 80%26 50%10 25%Less than 10%FGM/C is not concentrated in these countri esFGM/C is concentrated in a swath of countries from the Atlantic Coast to the Horn of AfricaPercentage of girls and women aged 15-49 years who have undergone FGM/C, 2004-2014 In half of the countries, the majority of girls underwent FGM/C before age 5. In the rest of the countries, most cutting occurs between ages 5 and 14.