Transcription of Choosing and Using Quantitative Research …
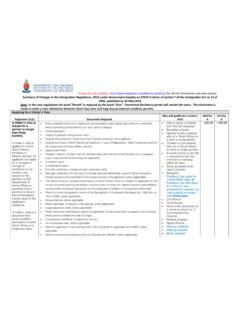
1 Choosing and Using Quantitative Research methods and Tools PROF CME mccrindle . Research I've noticed . problem Research Hypothesis I think . I wonder? question This is the cause How/ what? Testing This is the reason Why? Building theory theory This is the truth Is this true? Research How do I test How do I Research design this? answer this? design NNM 820: THEME 4 & 5 2. Research project steps REVIEW OTHER PEOPLE'S OPINIONS ON TOPIC. DEVELOP Research QUESTION. COLLECT AND ANALYSE DATA TO SUPPORT ARGUMENT. DISCUSSION OF FINDINGS. Research CONCLUSIONS. methods :THREE STAGES. PLANNING. DATA COLLECTION. DATA ANALYSIS. Research topics How to select a Research topic Gr&index=1.
2 CzB7lo&index=2&list=PL6dr1_iNtkeirR9 FHM5 QbcMrDGZH0dEGr Dependent and Independent variables : Gr&index=3. Dependent and Independent Variables Which axis is the dependent variable? Which is the independent variable? From Research question to thesis Colorado State University has a detailed online course that explains how you move from a Research question to a hypothesis: Examine your question and do a little brainstorming as to what the possible answer(s) might be: make some educated guesses and write them down.. ( ). A good way to do this is to read your Research question to yourself a few times, then discuss it with a friend. Then write about 100 -200 words that you think would be the conclusion of your thesis, starting with it is concluded that.
3 This should answer your Research question . Definitions Data: Facts of any kind. Data gathering: Facts that are collected in a systematic way and carefully and accurately recorded in a data base Data base: A systematic collection of information, listed in written form or electronically, which can be used for statistic or epidemiological calculations. Classification of data The following diagram illustrates the classification of data. DATA. QUALITATIVE Quantitative . (Categorical). NOMINAL ORDINAL DISCRETE CONTINUOUS. DICHOTOMOUS. INTERVAL RATIO. SCALE SCALE. QUALITATIVE DATA Quantitative DATA. Attributes, labels or non numerical Numerical entries.
4 This is measurements or called Categorical counts Data City (qualitative) Population ( Quantitative ). Polokwane 801 257. Johannesburg 2 845 968. Krugersdorp 350 125. QUALITATIVE. Categorical data are qualitative data that are grouped into categories. Examples are nominal (named), ordinal (ordered) and dichotomous (presence/absence or yes/no). data. Examples are species of animal (nominal=sheep, goat, cow), body condition score (ordinal= ), specimens tested either positive or negative for a disease (Dichotomous=. positive/negative), or gender (Dichotomous=male or female), Quantitative . Numerical data are Quantitative data that have values. Numerical data can be further divided into discrete or continuous.
5 Discrete data are whole numbers such as number of cows and generate counts for data analysis. Continuous data are measurements like time (values between millions of years and nano-seconds are possible), distances or weights. Continuous data can be further divided into interval and ratio scales. The ratio scale has a true zero point ( an animal cannot have a weight of less than zero). For the interval scale the distance between two points on a scale is accurately measured on either side of a zero point ( Temperature). Qualitative versus qualitative Classifications Qualitative Research Quantitative Research Purpose To understand & interpret social interactions.
6 To test hypotheses, look at cause & effect, & make predictions. Group Studied Smaller & not randomly selected. Larger & randomly selected. Variables Study of the whole, not variables. Specific variables studied Type of Data Collected Words, images, or objects. Numbers and statistics. Form of Data Collected Qualitative data such as open- ended responses, Quantitative data based on precise measurements interviews, participant observations, field notes, & Using structured & validated data-collection instruments. reflections. Type of Data Analysis Identify patterns, features, themes. Identify statistical relationships. Objectivity v Subjectivity Subjectivity is expected.
7 Objectivity is critical. Role of Researcher Researcher & their biases may be known to Researcher & their biases are not known to participants participants in the study, & participant characteristics in the study, & participant characteristics are may be known to the researcher. deliberately hidden from the researcher (double blind studies). Results Particular or specialized findings that is less Generalizable findings that can be applied to other generalizable. populations. Scientific Method Exploratory or bottom up: the researcher generates Confirmatory or top-down: the researcher tests the a new hypothesis and theory from the data hypothesis and theory with the data.
8 Collected. View of Human Behavior Dynamic, situational, social, & personal. Regular & predictable. Most Common Research Objectives Explore, discover, & construct. Describe, explain, & predict. Focus Wide-angle lens; examines the breadth & depth of Narrow-angle lens; tests specific hypotheses. phenomena. Nature of Observation Study behavior in a natural environment. Study behaviour under controlled conditions; isolate causal effects. Nature of Reality Multiple realities; subjective. Single reality; objective. Final Report Narrative report with contextual description & direct Statistical report with correlations, comparisons of quotations from Research participants.
9 Means, & statistical significance of findings. Quantitative Data Analysis The process of presenting and interpreting numerical data Using statistical techniques Primary data analysis: analysing data you collect Secondary data analysis: analysing data someone else collected Statistics? Watch the youtube video Introduction to Statistics . Watch the youtube video Statistics, variables, scales of measurement . Sampling strategies Simple random sampling. This is the simplest form of probability sampling.. Systematic sampling.. Stratified sampling.. Cluster sampling.. Multi-stage sampling. Which test to use? Choosing which statistical test to use - statistics help =5s Parametric and Nonparametric Statistical Tests Sampling size Confidence Intervals for a Proportion: Determining the Minimum Sample Size ibI.
10 Inductive and Deductive: Research Theory Analysis Hypothesis Observation Inductive and Deductive Research Inductive Research begins with an observation and Research question and leads to collection of empirical data, a hypothesis and a theory Deductive Research begins with a theory and hypothesis which guides data collection and analysis Experimental design Control group Randomly assign Study group subjects to control Unit of analysis and study groups Unit of analysis State A Intervention State A. Dependent Independent Dependent variable variable variable State A State B. 20. Laboratory vs field Laboratory Any artificial environment where variables can be controlled Minimise nuisance variables Field The actual environment in which a phenomenon was observed Cannot control all variables 21.