Transcription of Climate change in Queensland
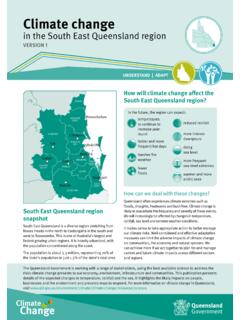
1 UNDERSTAND | ADAPTUNDERSTAND ADAPT | TRANSITIONUNDERSTAND ADAPT | TRANSITIONC limate changeVERSION 1in QueenslandIn the future, the state can expect:How will Climate change affect Queensland ? Queensland snapshotQueensland is Australia s second largest state by area and third largest by population. More than half of Queensland s estimated million residents live outside the greater metropolitan area of Brisbane a high proportion compared with the rest of highly urbanised Australia. Renowned worldwide for its diverse environment, Queensland has five of Australia s 11 World Heritage Areas and one of the Natural Wonders of the World the Great Barrier temperatureshotter and more frequent hot daysharsher fire weather fewer frosts reduced rainfall in the south-eastmore intense downpoursless frequent but more intense tropical cyclones in the northrising sea level more frequent sea-level extremes warmer and more acidic seasBrisbaneMaryboroughRockhamptonMackay TownsvilleCairnsWeipaNormantonMt IsaLongreachCharlevilleRomaToowoombaHow can we deal with these changes?
2 Queensland often experiences Climate extremes such as floods , droughts, heatwaves and bushfires. Climate change is likely to exacerbate the frequency and severity of these events. We will increasingly be affected by changes in temperature, rainfall, sea level and extreme weather conditions. It makes sense to take appropriate action to better manage our Climate risks. Well-considered and effective adaptation measures can limit the adverse impacts of Climate change on communities, the economy and natural systems. We can achieve more if we act together to plan for and manage current and future Climate impacts across different sectors and regions. The Queensland Government is working with a range of stakeholders, using the best available science to address the risks Climate change presents to our economy, environment, infrastructure and communities.
3 This publication presents details of the expected changes to temperature, rainfall and the sea. It highlights the likely impacts on people, businesses and the environment and presents ways to respond. For more information on Climate change in Queensland , visit ADAPT | TRANSITIONUNDERSTAND2 |Looking to the futureQueensland 2030In 2030, under a high emissions scenario, the Climate of Brisbane will be more like the current Climate of Bundaberg, and the Climate of Cairns more like the current Climate of find out what the future Climate will be like where you live, use the Climate analogues tool on the Climate change in Australia website at The tool matches projected rainfall and maximum temperature with the current Climate experienced in another location for the years 2030, 2050 and current climateQueensland is a vast state with great variations in Climate , from the temperate south to the tropical north and the arid west.
4 South East Queensland , which includes Brisbane and the Gold and Sunshine Coasts, experiences warm summers with average maximum temperatures of 29 C and winter maximum temperatures averaging 20 Cape York region s Climate is tropical, with high to very high temperatures throughout the year. Average maximum temperatures range from 32 C during December to February (the humid wet season) to 29 C from July to August. Western Queensland has a semi-arid to arid Climate with very hot summers and warm, dry winters. The temperatures range from 37 C in summer to 24 C in and seasonal average rainfall is variable, affected by local factors such as topography and vegetation, and broader scale weather patterns, such as the El Ni o Southern Oscillation.
5 Most of Queensland s rainfall occurs in summer. The total summer rainfall in southern Queensland often exceeds 500mm. The north is much wetter, with annual rainfall of over 1000mm. Arid areas in the west have annual rainfall below south-easterly trade winds produce rainfall along the eastern coast throughout the year. Tropical cyclones bring significant rainfall to the , the Climate is changing across Queensland . Average temperatures across the state are currently 1 C higher than they were 100 years ago. Recent decades have shown a clear warming trend. Our Climate is already highly variable but Climate change is leading to shifts beyond this natural future climateOur Climate is changing primarily because increasing amounts of greenhouse gases in the atmosphere are trapping heat, warming the air and oceans.
6 To determine what our future Climate might be, scientists use global Climate models to simulate the Earth s Climate system. The models use a set of mathematical formulae that describe the physical processes of the atmosphere, ocean, land and ice. Population, the economy, policy decisions and technology will all affect future emissions of greenhouse gases. We don t know exactly what these effects will be, so to cover a range of possibilities, scientists use emissions scenarios called representative concentration pathways (RCPs) to develop Climate projections. These projections describe a lower emissions future, where greenhouse gas emissions are substantially reduced (using a scenario termed ), and a high emissions future, where high levels of greenhouse gas emissions are set to continue (using a scenario termed ).
7 The projections in this summary are given for 20-year periods centred on 2030 and 2070. The 2030 high and low emissions scenarios are so similar that only the high emissions scenario has been used in this publication. Projections are represented as a change relative to the average for the period 1986 2005. For example, in 2070 under a high emissions scenario, average temperature in Queensland is projected to rise by C ( to C). In this case, the middle temperature rise determined by all the models is C. The range is between C and C, meaning 95% of model results indicated a rise of at least C and 95% of the model results indicated a rise of C or Queensland Climate Transition Strategy outlines how we will transition to a zero net emissions future that supports jobs, industries, communities and the environment.
8 Find the strategy at | 3 Higher temperaturesMaximum, minimum and average temperatures are projected to continue to rise. For the near future (2030), the annual average warming is projected to be between and C above the Climate experienced between 1986 and 2005. By the year 2070, the projected range of warming is between C (low emissions) and C (high emissions).The state s summer average temperature is 29 C. This could rise to over 30 C by 2030 and to over 32 C by 2070. Hotter and more frequent hot daysThere is likely to be a substantial increase in the temperature reached on the hottest days, and an increase in the frequency of hot days and the duration of warm frostsA substantial decrease in the frequency of frost risk days is projected by fire weather Fire weather is a measure of fuel dryness and hot, dry, windy conditions.
9 Climate change is likely to result in harsher fire weather in the annual average temperature changes for . The horizontal line on each bar is the middle (median) projected temperature change . The extent of each bar indicates the range of projected emissions2070lower emissions2070high emissionsannual temperature change (oC)Natural variability; reduced rainfall in the south-eastHigh Climate variability is likely to remain the major factor influencing rainfall changes in the next few decades. In the south-east of the state, rainfall projections for 2070 show little change or a slight decrease, particularly in winter and spring. Across the state, high variability will intensity of heavy rainfall events is likely to annual and seasonal rainfall changes for the region.
10 The horizontal line on each bar is the middle (median) projected rainfall change . The extent of the bar indicates the range of projected emissions2070lower emissions2070high emissionsrainfall change (%)summerautumnwintersummerautumnwinters ummerautumnwinterspringspringspringannua lannualannualChanges to drought are less clear Projecting changes in the frequency and duration of drought is difficult. However, by late this century, under a high emissions scenario, it is likely that the south of the state will experience more time in level will continue to riseSea level is projected to rise by above present day levels by frequent sea-level extremesHigher sea levels will increase the risks of coastal hazards such as storm tide and more acidic oceanSea surface temperature has risen significantly across the globe over recent decades and warming is projected to continue.