Transcription of Climate Change - State of the Science
1 Climate Change - State of the Science by Prof. Stefan Rahmstorf Potsdam Institute for Climate Impact Research ( ~stefan) Some basic facts about global warming Important core findings of Climate research have been so well con-firmed in recent decades that they are now generally accepted as fact by Climate researchers. These core findings include the follow-ing: 1. The atmospheric CO2 concentration has risen strongly since about 1850, from 280 ppm (a value typical for warm periods dur-ing at least the past 700,000 years) to over 380 ppm. 2. This rise is entirely caused by humans and is primarily due to the burning of fossil fuels, with a smaller contribution due to defores-tation. 3. CO2 is a gas that affects Climate by changing the earth s radia-tion budget: an increase in its concentration leads to a rise in near-surface temperature. This has been known since the 19th Century and is well-established physics.
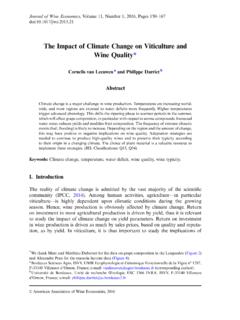
2 If the concentration dou-bles, the resulting global mean warming will very likely be be-tween 2 and 4 C (the most probable value is ~3 C), with the re-maining uncertainty due to climatic feedback effects. 4. Since 1900, global Climate warmed by ~ C. Temperatures in the past ten years have been the highest since measured re-cords started in the 19th century and for many centuries before that (Fig. 1). 5. Most of this warming is due to the rising concentration of CO2 and other anthropogenic gases. These would in fact explain more warming than is observed, were they not offset in part by the cooling effect of aerosol pollution (smog). Fig. 1. Global mean temperature up to 2009 according to the two main data compilations: NASA in red and Hadley Centre in blue. Dots show annual values, heavy lines a non-linear trend smoothed over 15 years. Numbers are deviations relative to 1951-1980.
3 These findings are based on decades of research and thousands of studies. The extraordinary consensus reached is seen in the State -ments of many international and national professional bodies which have extensively and critically assessed the scientific evidence. In addition to the well-known reports of the IPCC, there are public statements of the National Scientific Academies of all G8 countries, the American Geophysical Union (AGU), the World Meteorological Organisation (WMO), the scientific Advisory Council on Global Change (WBGU) of the German government, and many others. These organisations have again and again come to the same key conclusions. From points 1. 3. follows that a further increase in CO2 concentra-tion must lead to a further rise in global mean temperature (Fig. 2). For a range of plausible assumptions about future emissions, by the year 2100 this rise will reach 2 - 7 C above preindustrial values.
4 Fig. 2. IPCC projections for global mean temperature in the 21st Century. The uncertainty ranges for three different emissions scenarios are shown (B1, A2 and A1FI). For comparison, a reconstruction for temperatures of the past centuries is included (Mann et al. 2008, blue with uncertainty range) as well as observed temperatures from 1860 (black). For comparison: the last major global warming was the end of the last great Ice Age (about 15,000 years ago); it involved a global warming of ~5 C over a time span of 5,000 years. Unchecked an-thropogenic warming could reach a similar magnitude over a fraction of this time and, of course, starting from an already warm Climate . Impacts and risks Whether this warming is considered a "dangerous" Climate Change can, of course, not be determined by scientists alone, as it depends on a societal value judgment about what is dangerous.
5 However, Science can help to clarify what are the risks that arise from such unprecedented warming. Amongst the most important risks are the following: Sea level rise and loss of ice sheets. In the 20th Century global sea level increased by 15 - 20 cm. Currently sea level is rising at over 3 cm/decade, faster than projected in the model scenarios of the IPCC. Future rise by 2100 could exceed one meter. Even if warming is stopped at 3 C, sea level will probably keep rising by several meters in subsequent centuries in a delayed response (Fig. 3). Coastal cities and low-lying islands are at risk. What is now a once-in-a-century extreme flood in New York City (with ma-jor damage, including flooded subway stations) would statistically occur about every 3 years if sea level were just 1 meter higher. Loss of ecosystems and species. Global temperatures would reach a high never seen for millions of years, and the rise would be much too fast for many species to adapt.
6 A large fraction of species - some studies suggest up to one third of species - could be doomed for extinction already by the year 2050. Life in the oceans is not only threatened by Climate Change but by the equally serious problem of the ongoing global ocean acidification, which is a direct chemical result of our CO2 emissions. How to avoid dangerous Climate Change In the United Nations Framework Convention on Climate Change (UNFCCC) of 1992, almost all nations of the world have committed themselves to preventing a "dangerous interference" with the Climate system. To avoid the most dangerous consequences of Climate Change , the Copenhagen Accord of 2009 calls for keeping global warming below 2 C above pre-industrial temperatures, possibly even less. To reach this goal, the greenhouse gas concentration in the atmosphere needs to be stabilised well below 450 ppm CO2-equivalent (possibly after some limited temporary overshooting of this value).
7 To achieve this, the global CO2 emissions need to be reduced by 50-80% by 2050, compared to the level of 1990. Carbon cycle feed-backs and Climate sensitivity make the exact number uncertain (see Fig. 5). Fig. 3 Mean global temperature and sea level (relative to today s) at different times in Earth s history, with the projection for the year 2100 (1m above today s sea level). For the long term a much higher sea-level rise must be expected than that predicted for 2100. Source: after Archer, 2006. Risk of extreme events. In a warmer Climate , the risk of extreme flooding events will increase as warmer air can hold more water (7% more for each C of warming). Droughts and forest fires are likely to increase in some regions, as is currently occurring in the Mediterranean region, Southern Africa and California. Hurricanes are expected to become more destructive.
8 An increase in energy of hurricanes is suggested in response to rising sea surface tem-peratures by both models and data (Fig. 4). A number of recent studies has shown that the observed rise of sea surface tempera-tures in the relevant areas of the tropics is primarily due to global warming, not to a natural cycle. Fig. 5 Comparison of different emission scenarios for the period 1990 to 2060. Red curves are the well-known IPCC SRES scenarios without Climate protection policies ( non-mitigation ). Yellow is a set of scenarios leading to a 50% chance to stay within the 2-degree policy limit. The green scenarios have a 75% chance of staying below this threshold. (Meinshausen et al 2009). According to latest economic modeling results (see special issue of the Energy Journal, 2006, edited by O. Edenhofer et al., as well as the Stern Review published in November 2006), this can be achieved with minimal costs (around 1% lower GDP by 2100) by induced tech-nological innovation, including increased energy efficiency and re-newable energy technologies (wind, biomass, solar).
9 Detailed sce-narios for the required energy transition have been worked out by the Advisory Council on Global Change of the German govern-ment ( ). Sources Archer, D., 2006: Global Warming: Understanding the Forecast. Blackwell, 256 pp. Emanuel, K., 2005: Increasing destructiveness of tropical cyclones over the past 30 years. Nature, 436, 686-688. Edenhofer, O., Carraro, C., Koehler, J., Grubb, M. (eds) (2006): Endogenous Techno-logical Change and the Economics of Atmospheric Stabilisation. A Special Issue of The Energy Journal, Vol. 27, International Association of Energy Economics, USA. Mann, M. E., et al. (2008) Proxy-based reconstructions of hemispheric and global surface temperature variations over the past two millennia, Proceedings of the Na-tional Academy of sciences of the United states of America 105: 13252-13257. Meinshausen, M., et al.
10 , 2009: Greenhouse-gas emission targets for limiting global warming to 2 C. Nature, 458: p. 1158-1163. WBGU 2003: Beyond Kyoto Special Report, ( ) --- Figs. 3 and 4 are reproduced from the 2006 report The Future Oceans - Warming Up, Rising High, Turning Sour of the WBGU. ( )For more information, see the books The Climate Crisis and Our Threatened Oceans, the author's web page at and the Climate Change weblog 4. Temporal development of the energy of tropical storms (Power Dissi-pation Index PDI, red) and the average sea-surface temperature in the tropical Atlantic from August to October (blue). For comparison the evolution of the globally averaged near-surface air temperature is shown (dashed grey line). Source: after Emanuel, 2005 Risk to water and food supplies. While the total global agricul-tural production may not decline in a warmer Climate , many poorer and warmer countries can expect reductions in yields due to water shortages and weather extremes.