Transcription of CMEG Exchange Volume Report - Monthly - CME Group
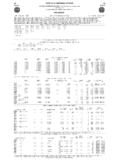
1 cmeg Exchange Volume Report - MonthlyInterest Rate Futures10-YR NOTE27,450,92025,570, ,837, ,782,647122,350, SWAP RATE23,51329, , ,249198, EURODOLLAR1,2828, , ,51115, NOTE7,441,2565,031, ,652, ,669,77728,528, SWAP BOND5,517,1894,613, ,379, ,119,46122,747, SWAP , NOTE16,208,01913,761, ,974, ,873,70273,885, SWAP RATE13,49837, , ,667229, ,086,44051,369, ,329, ,761,099243,992, FUND4,571,8363,821, ,107, ,840,45919,430, 10-Year Note2,611,5431,490, ,533, ,200,2037,912, T-BOND2,354,3421,613, ,785, ,916,8359,709, Rate Options10-YR NOTE9,712,49311,296, ,075, ,522,03942,908, NOTE557,66582, , ,923,691371, BOND2,369,7661,836, ,284, ,093,2697,806, NOTE2,404,1132,408, ,353, ,806,84011,477, ,288,65116,361, ,837, ,175,88464,216, MIDCURVE12,332,73017,680, ,204, ,729,96669,686, , ,7178, 10-Year , T-BOND10,9383, , ,4388, 2018 VOLUMEAPR 2017% CHGVOLUMEMAR 2018% 2017% CHGThe information herein is taken form source believed to be reliable.
2 However, it is intended for the purposes of information and education only and is not guaranteed by the CME Group as to accuracy,completeness, nor trading results and does not constitute advice or continue a solicitation of the purchase or sale of any futures or options. The Rules and Regulations of the CME Group should beconsulted as the authoritative source on all current contract specifications and regulations. The previous year Average Daily Volume (ADV) may slightly differ for CBOT legacy products based on the wayCME Group defines the number of trading days. The open interest values are based on preliminary open interest values only.** Note - KC HRW Wheat Monthly and YTD Volume comparatives to prior year is not using a complete year, since collection of 2013 Volume data did not start untilApril 15, Exchange Volume Report - MonthlyEquity Index FuturesBITCOIN FUTURES78,6500-54, ,7350-DJ US REAL ESTATE19,16018, , ,09497, ($5) Dow5,479,4052,722, ,939, ,634,56511,473, FTSE 100 (USD)
3 1,3341013, , ,5863422, FTSE China 501, ,6585, MIDCAP332,663327, , ,670,7551,531, NASDAQ 10010,030,7264,376, ,243, ,374,88617,105, RUSSELL 10009, , ,8974,2371, RUSSELL 1000 GROWTH18,9341,3871, , ,0662,7161, RUSSELL 1000 VALUE7,9021, , ,4358, RUSSELL 20002,225,3310-3,855, ,348,3800-E-MINI S&P50035,694,30927,397, ,449, ,243,770126,179, S&P REAL ESTATE SELE8,7705, , ,99918, 1001, , , INDEX1, ,4752, , , 50014, ,44428, 225 ($) STOCK242,944242, , ,661,2241,144, 225 (YEN) STOCK757,063829, ,284, ,242,0143,795, 500136,74277, , ,663542, 500 500/VALUE8,80221, , ,40165, CONSUMER DSCRTNRY SE19,0612, , ,75734, CONSUMER STAPLES SECT18,2623, , ,02939, ENERGY SECTOR27,70710, , ,33664, FINANCIAL SECTOR60,22118, , ,13091, HEALTH CARE SECTOR10,8906, , ,02955, INDUSTRIAL SECTOR18,1062, , ,25724, MATERIALS SECTOR7,2422, , ,27627, TECHNOLOGY SECTOR21,7773, , ,72228, UTILITIES SECTOR28,72915, , ,51688, DENOMINATED ,0570-VOLUMEAPR 2018 VOLUMEAPR 2017% CHGVOLUMEMAR 2018% 2017% CHGThe information herein is taken form source believed to be reliable.
4 However, it is intended for the purposes of information and education only and is not guaranteed by the CME Group as to accuracy,completeness, nor trading results and does not constitute advice or continue a solicitation of the purchase or sale of any futures or options. The Rules and Regulations of the CME Group should beconsulted as the authoritative source on all current contract specifications and regulations. The previous year Average Daily Volume (ADV) may slightly differ for CBOT legacy products based on the wayCME Group defines the number of trading days. The open interest values are based on preliminary open interest values only.** Note - KC HRW Wheat Monthly and YTD Volume comparatives to prior year is not using a complete year, since collection of 2013 Volume data did not start untilApril 15, Exchange Volume Report - MonthlyEquity Index OptionsE-mini ($5)
5 Dow8,5182, , ,95721, NASDAQ 100257,136126, , ,126,043675, RUSSELL 20005,1240-25, ,8430-E-MINI S&P5004,864,4393,021, ,064, ,553,19215,848, E-MINI RUSSELL 2000 END 1,9840-14, ,3300-EOM EMINI S&P1,892,1202,201, ,239, ,431,5318,400, S&P 50086,640166, , ,729738, E-MINI RUSSELL 2000 WE2,4250-3, ,9630-EOW1 E-MINI RUSSELL 2000 WE3,0080-4, ,1460-EOW1 EMINI S&P 5001,274,6771,310, ,004, ,961,4014,804, S&P 50074,42897, , ,837307, E-MINI RUSSELL 2000 WE4,6090-7, ,2290-EOW2 EMINI S&P 5001,697,5011,139, ,046, ,550,5084,584, S&P 500137,38964, , ,147611, E-MINI RUSSELL 2000 WE22,6140-44, ,8910-EOW3 EMINI S&P 5004,642,0924,384, ,298, ,060,69115,666, S&P 500337,128400, , ,708,4641,511, E-MINI RUSSELL 2000 WE3,8560-16, ,1820-EOW4 EMINI S&P 5001,228,54659,7171, ,686, ,887,0413,514, 500194,223177, , ,389,1251,153, FuturesALUMINUM17,6116, , ,61560, COPPER3,090,9572,266, ,510, ,363,3268,135, E-Mini GOLD6,9887, , ,54538, E-Mini SILVER1, , ,9593, GOLD6,655,0614,612, ,036, ,931,58521,102, MINY ,3993, SILVER2,625,7562,120, ,842, ,810,3856,840, , , GOLD133,40584, , ,152345, PRODUCTS1,487304, ,1942154, , ORE 62 CHINA PLATTS , ORE 62 CHINA TSI FUTURE3,58911, , ,41444, HOT ROLLED STEEL12,0741, , ,23612, PLATINUM423,705280, , ,777,0061,428, ,13897, , ,691449, ,3354, , ,26819, , 2018 VOLUMEAPR 2017% CHGVOLUMEMAR 2018% 2017% CHGThe information herein is taken form source believed to be reliable.
6 However, it is intended for the purposes of information and education only and is not guaranteed by the CME Group as to accuracy,completeness, nor trading results and does not constitute advice or continue a solicitation of the purchase or sale of any futures or options. The Rules and Regulations of the CME Group should beconsulted as the authoritative source on all current contract specifications and regulations. The previous year Average Daily Volume (ADV) may slightly differ for CBOT legacy products based on the wayCME Group defines the number of trading days. The open interest values are based on preliminary open interest values only.** Note - KC HRW Wheat Monthly and YTD Volume comparatives to prior year is not using a complete year, since collection of 2013 Volume data did not start untilApril 15, Exchange Volume Report - MonthlyMetals OptionsCOMEX COPPER24,3643, , ,21615, GOLD959,339783, , ,842,7223,134, SILVER177,207113, , ,200418, ,38510, , ,57440, ROLLED COIL STEEL CALL ORE 62 CHINA TSI CALL O03, , ORE 62 CHINA TSI PUT ,08012, PLATINUM9412, , ,53410, ,5904, , ,36213, , , FUEL OIL CID MED FUEL OIL CIF BALMO HUB HUB HUB OFF-PEAK CITY GATES NAT CITYGATES LOUISIANA BASIS COAL (PHY) LLS VS.
7 WTI (ARG) T20,0007, , ,41529, PROPAN FAR EST INDE7,8631, , ,0035, PROPAN(SAUDI ARAMC3, , ,5544, COKE BALMO CALENDAR SWAP4,5481, ,55011, CFD FINANCIAL , ,64411, OIL LAST DAY1,968,4241,839, ,821, ,854,7227,794, SP15 EZGNHUB5 MW , SP15 EZGNHUB5 LIGHT SWEET , BASIS EAST ENERGY6,4340-6, ,4260-CHICAGO ETHANOL SWAP105,967107, , ,962497, ULSD (PLATTS) ULSD PL VS HO , UNL GAS PL VS ROCKIES NG INDEX HUB OFF-PEAK HUB PEAK HUB 5MW D AH O PK045, , HUB 5MW D AH PK1,1004, , ,60410, HUB 5MW REAL TIME O P091, , 2018 VOLUMEAPR 2017% CHGVOLUMEMAR 2018% 2017% CHGThe information herein is taken form source believed to be reliable. However, it is intended for the purposes of information and education only and is not guaranteed by the CME Group as to accuracy,completeness, nor trading results and does not constitute advice or continue a solicitation of the purchase or sale of any futures or options.)
8 The Rules and Regulations of the CME Group should beconsulted as the authoritative source on all current contract specifications and regulations. The previous year Average Daily Volume (ADV) may slightly differ for CBOT legacy products based on the wayCME Group defines the number of trading days. The open interest values are based on preliminary open interest values only.** Note - KC HRW Wheat Monthly and YTD Volume comparatives to prior year is not using a complete year, since collection of 2013 Volume data did not start untilApril 15, Exchange Volume Report - MonthlyEnergy FuturesCIN HUB 5MW REAL TIME PK05, , GULF MAINLINE NG GULF MAIN NAT GULF NATURAL GASOLINE ( , NORMAL BUTANE ( , PROPANE 5 DECIMALS15,9436, , ,57632, OIL4,5303, , ,79442, OIL OUTRIGHTS53,85221, , ,78169, OIL PHY27,977,11321,225, ,003, ,268,11990,599, OIL SPRDS42,8048, , ,52925, OIL TRADE AT MARKER BRENT (PLATTS)))
9 DAILY TO FRONTLINE ,6604, INDEX SWING 10P BRG FOB RDM 10 PPM BARGES FOB GAS EURO-BOB TRAN INC - APP TRANSMISSION INC03, , CRUDE OIL CRUDE OIL CALENDAR1,1844, ,94429, EURO FUEL OI , RAIL DELIVERY , FUEL OIL , FLAT TAX ONHWAY , ERCOT DLY OFF ERCOT DLY ERCOT OFF PEAK19,6000-0-19,6000-ELEC MISO NYISO ERCOT OFF WEST POWER WEST POWER , PASO PERMIAN INDEX DAILY 5MW HOUSTON Z MCPE 5MW ,5100-ERCOT NORTH ZMCPE 5MW NORTH ZMCPE 5MW OF19, , NORTH ZMCPE 5MW , ,23816, , ,63669, , T2 FOB ROTT INCL DU3,4043, , ,53114, 1% FUEL OIL NEW 2018 VOLUMEAPR 2017% CHGVOLUMEMAR 2018% 2017% CHGThe information herein is taken form source believed to be reliable. However, it is intended for the purposes of information and education only and is not guaranteed by the CME Group as to accuracy,completeness, nor trading results and does not constitute advice or continue a solicitation of the purchase or sale of any futures or options.
10 The Rules and Regulations of the CME Group should beconsulted as the authoritative source on all current contract specifications and regulations. The previous year Average Daily Volume (ADV) may slightly differ for CBOT legacy products based on the wayCME Group defines the number of trading days. The open interest values are based on preliminary open interest values only.** Note - KC HRW Wheat Monthly and YTD Volume comparatives to prior year is not using a complete year, since collection of 2013 Volume data did not start untilApril 15, Exchange Volume Report - MonthlyEnergy FuturesEURO FUEL OIL RDAM ,4302, FUEL OIL , PETRO , GASOIL 10 CAL GASOIL 10 PPM VS 1% FUEL OIL NWE 1% FUEL OIL RDAM FUEL OIL , FUEL OIL RDAM11,8036, , ,69438, GASOIL (ICE)7282, ,66211, NAPHTHA ,0991, NAPTHA CRACK SP8,4225, , ,34528, DATED BRENT JET KERO NWE NAPHTHA CALSWAP2,3922, , ,66010, PROPANE CIF ARA SWA1, , ,3894, GAS ZONE 3 NAT GAS GAS ZONE3 BASIS , OIL CRACK VS ICE3,9322, , ,51415, OIL NWE CRACK VS OIL (PLATS) CAR OIL (PLATS) CAR SWAP.