Transcription of Collaborative Project Goal PREDICTIVE ANALYTICS
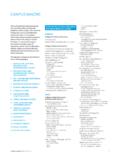
1 Collaborative Project Goal PREDICTIVE ANALYTICSM enteesOregon State UniversityUniversity of KansasIowa State UniversityThe Ohio State UniversityMichigan State UniversityUniversity of California at RiversidePurdue UniversityUniversity of Central Florida Project goals GEORGIA STATE university MENTORSHIP EXAMPLET hrough the use of PREDICTIVE ANALYTICS and proactive advising interventions, Georgia State university has been able to increase semester-to-semester retention rates by 5 percent and reduce time-to-degree for graduating students by almost half a semester. This means that 1,200 more students are staying in school every year and that Georgia State s graduating Class of 2014 saved $10 million in tuition and fees compared to the graduates a year ago.
2 In addition, by this year s students graduating more quickly, Georgia taxpayers were saved approximately $5 million in support costs for public educational. Extended out over the next five years, these innovations would result in 3,400 more students graduating from Georgia State and total savings to students and taxpayers of $75 these same innovations were scaled across the eleven institutions of the university Innovation Alliance with comparable gains, this would translate into 19,000 more students staying enrolled and graduates of the UIA saving almost $200 million in tuition-and-fee costs every year. Taxpayers would save $100 million in educational costs.
3 Over the next five years, these innovations would produce more than 61,000 additional graduates from UIA institutions and save almost $ billion in educational costs to students and the innovations were scaled across all public universities nationally, they have the potential to help 335,000 additional students stay in college every year. They would result in $ billion in saved tuition and fees annually for students with an additional $ billion in cost savings to taxpayers. Over the next five years, this single scaled Project could produce more than 850,000 additional college graduates from America s public universities and save $18 billion in total educational State UniversityArizona State UniversityUniversity of Texas at AustinGeorgia State UniversityUniversity Innovation Alliance institutions All public universities$3 bn$2 bn$1 bnAnnual education cost savings(in billions)Annual additional student enrollment (one circle = 1,000 students)
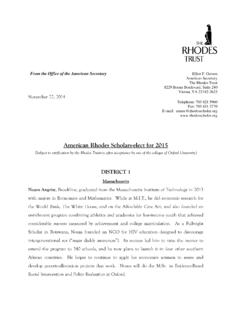
4 $ billion335,000 studentsCollaborative Project Goal PREDICTIVE ANALYTICSM enteesOregon State UniversityUniversity of KansasIowa State UniversityThe Ohio State UniversityMichigan State UniversityUniversity of California at RiversidePurdue UniversityUniversity of Central Florida Project goals ARIZONA STATE university MENTORSHIP EXAMPLED eveloping eAdvisor to help undergraduates identify majors related to their interests has helped reduce the number of exploratory majors at the university from one-third of freshman students to only 8 percent of freshman. Students not only find majors through the system, but they map their classes and track progress toward completing their degrees.
5 Launched for the 2007 08 entering class, the system has been expanded to all undergraduate students. Implementing eAdvisor has generated $ million in advising costs savings per year at ASU and $ million in instructional cost savings per year. Given the improvements in persistence and graduation rates, the per student average cost savings is $31,000 per year. Student success has increased at ASU since eAdvisor s implementation by: The four-year graduation rate of the first eAdvisor cohort improved by more than 9 percentage points relative to pre-eAdvisor cohorts. The five-year graduation rate improved by nearly 7 percentage points and ASU projects their six-year rate to be about 5 percentage points higher than before eAdvisor was implemented.
6 The 2009 cohort has already achieved a four-year graduation rate that is 12 percentage points higher before eAdvisor was introduced. A critical success of eAdvisor and other related initiatives have been improvements in the success of lower-income students. The four-year graduation rate for resident students coming from families making less than $50,000 per year increased from 26 percent in the 2006 cohort to 41 percent in 2009. This improvement was so great thatlower-income students in 2009 graduated at nearly the same rate as students coming from families making more than $80,000 per year in the 2006 State UniversityArizona State UniversityUniversity of Texas at Austin$ bn$ bn$ bnEstimated eAdvisor annual education cost savings(in billions)Estimated eAdvisor annual additional baccalaureate degrees(one circle = 100 students)
7 $ billionArizona State UniversityUniversity Innovation Alliance institutions All public universities53,000 studentsCollaborative Project Goal PREDICTIVE ANALYTICSM enteesOregon State UniversityUniversity of KansasIowa State UniversityThe Ohio State UniversityMichigan State UniversityUniversity of California at RiversidePurdue UniversityUniversity of Central Florida Background university OF TEXAS AT AUSTIN MENTORSHIP EXAMPLEUT Austin uses PREDICTIVE ANALYTICS to help identify incoming students who might be underprepared for the university . The algorithm compiles more than a decade of comprehensive historical data from tens of thousands of students to provide tools for predicting outcomes for students who enroll at UT Austin.
8 The Four Year Graduation Rate model incorporates fourteen key demographic and academic factors such as residency status, parent income, first generation, and high-school credits in core subjects to forecast the likelihood of each student s graduating in four years. It also assists academic units in allocating financial aid and assigning students to academic support programs. The predicted graduation rate is applied to every incoming student who is admitted to the university . PREDICTIVE ANALYTICS in PracticeThe use of PREDICTIVE ANALYTICS is instrumental in helping UT Austin identify students who need additional academic support and personal engagement and will benefit most from specific support programs.
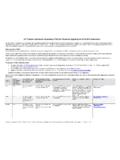
9 The university Leadership Network (ULN), started in the 2013 2014 academic year, is a scholarship and experiential learning program which uses PREDICTIVE ANALYTICS to identify students with academic and financial need and help them develop leadership skills. Students receive $5,000 per year over four years, paid out in ten $500 payments. During their first-year, students in ULN work on academic and professional development while performing community service, participating in discussion groups, and attending weekly seminars on topics such as time management, professional branding, and team building. In their second-year, students intern in various on-campus offices where they learn real-world job State UniversityArizona State UniversityUniversity of Texas at AustinULN 2013 2014 Cohort Profile (Class of 2017)ULN Student Performance v.
10 Comparison Group2013 2014 2013 2014 Cohort Student (502 students total) All students have unmet need and are eligible for financial aid50% or less predicted 4 YR graduation rate (481 students, or 96%)SAT equivalent score of 1200 or less (408 students, or 81%)ULNC omparison GroupPersistence (fall to spring)93%85%GPA >= ( good standing )87%78%GPA >= < >= < >= GPA 30+Semester Credit Hrs*54%13%* Includes credit-by-exam