Transcription of College Statistics 2016-17 - Scottish Funding Council
1 College Statistics 2016 -17 Issue date: Reference: Summary: FAO: 30/01/2018 SFC/ST/01/2018 This publication provides an overview of College sector Statistics from 2006-07 to 2016 -17. Principals and Directors of Scotland s colleges Further information: Contact: Cathy Mitchell Job title: Senior Policy / Analysis Officer Department: Finance Email: Scottish Funding Council Apex 2 97 Haymarket Terrace Edinburgh EH12 5HD T 0131 313 6500 F 0131 313 6501 Contents Contents 2 List of Figures / Tables 3 Key points 4 Links to Key Points 5 Introduction 6 Trends in Student Numbers and Activity 7 Student Numbers and Enrolments 7 Volume of Activity 8 Trends in Mode and Duration of Study 12 Non-Recognised Qualifications and Courses Lasting Under 10 Hours 13 SFC Funded Hours of Learning 15 Student Characteristics 18 By Age 18 By Gender 19 By Disability 19 By Ethnicity 21 Further Information 23 Annex A: Measuring Student Numbers, Volume of Activity and Changes in Policy 24 Annex B.
2 Methodology - WSUMs to Credits 27 Implications for time-series 28 Annex C: College Outcome Agreements 29 3 List of Figures / Tables Figure 1 Number of Students and Enrolments, 2006-07 to 2016 -17 Table A Percentage of Students Enrolled on Multiple Courses, 2012-13 to 2016 -17 Table B Student Numbers and Volume of Activity in Scotland's Colleges, 2006-07 to 2016 -17 Table C Credits Delivered Against Target, 2016 -17 Figure 2 Delivery Against Target, 2006-07 to 2016 -17 Figure 3 FTEs Delivered Against FTE Target, 2012-13 to 2016 -17 Figure 4 Number & Proportion of Enrolments by Mode and Level of Study, 2006-07 to 2016 -17 Figure 5 Enrolments of Under 10 Hours and Non-Recognised Qualifications.
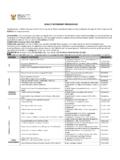
3 2006-07 to 2016 -17 Figure 6 Proportion of Learning Hours by Age Group, 2006-07 to 2016 -17 Figure 7 Average Hours of Learning - Part Time Students, 2006-07 to 2016 -17 Figure 8 Percentage of Learning Hours by Recognised Qualifications and Special Programmes, 2006-07 to 2016 -17 Table D Full-time, SFC-funded Students by Age, 2016 -17 Figure 9 Student Enrolments by Gender, 2006-07 to 2016 -17 Figure10 Percentage of Hours Delivered to Students with a Disability, 2006-07 to 2016 -17 Figure 11 Percentage of Learning Hours to students with a Disability by Programme Type, 2006-07 to 2016 -17 Figure 12 BME Student Learning Hours - Percentage of Total Learning Hours, 2006-07 to 2016 -17 Figure 13 Enrolments for Students from a Minority Ethnic Background, 2016 -17 Table E Students to Enrolments, 2016 -17 Table F Notable Changes in External Factors Affecting the College Sector Table G Selected National Performance Measures, 2014-15 to 2016 -17 4 Key points 1.
4 This report provides an overview of College sector Statistics from 2006-07 to 2016 -17. The figures include measurement of student numbers presented in terms of headcounts and enrolments. They also include measurements of College activity expressed in Credits, Hours of Learning and Full Time Equivalents (FTEs). The credit based system of Funding College activity was introduced in 2015-16, and this report is therefore presenting activity in Credits for the second time. 2. The key points from this report are: In 2016 -17 the College sector delivered 121,653 full-time equivalent (FTE) places. This included 117,502 SFC funded FTE places, higher than in 2015-16 and exceeding the sector FTE target of 116,269.
5 In 2016 -17 the College sector delivered 1,762,032 Credits. This included 1,699,760 Core Credits meaning that colleges exceeded the Core Credit target by In 2016 -17 the headcount total for the College sector was 235,737, an increase of from 2015-16. The enrolment total was 291,849, an increase of from 2015-16. The number of enrolments to full-time HE courses has remained at the same level between 2015-16 and 2016 -17, decreasing by 2 enrolments or The number of enrolments to full-time FE courses has also remained at the same level between 2015-16 and 2016 -17, increasing by 14 enrolments or The number of enrolments to part-time HE courses increased by 799 between 2015-16 and 2016 -17, equivalent to The number of enrolments to part-time FE courses, the largest group, increased by 9,996, or , between 2015-16 and 2016 -17.
6 Students aged 18 and 19 make up the largest proportion of full-time SFC funded enrolments, accounting for In 2016 -17, male students accounted for of all enrolments and this is the first time that there have been more total male enrolments than female enrolments in the College sector. In terms of Credits delivered, females accounted for 5 Under 1616 to 1718 to 1920 to 2425 and over2016-17 Students39212,92426,18517,52819,175 Difference from 2015-16-36-210217-211491 Difference from 2006-07-539-5659673645345662 Links to Key Points FTEs against Target: Page 11 Credits against Target: Page 10 Headcount Trends: Page 7 Enrolments Level of Study: Page 13 Enrolments by Age: Page 18 Enrolments by Gender: Page 19 6 Introduction 3.
7 This report provides an overview of College sector Statistics from 2006-07 to 2016 -17. Student numbers in the College sector are measured by both headcount and enrolments. This is because a student can enrol on multiple College courses within one academic year. Headcounts measure the number of students in an academic year and enrolments measure the number of times students enrol on programmes of study. This is explained in more detail in Annex A. 4. The Credit based system of Funding College activity was introduced in 2015-16, meaning that this is the second year of reporting on that basis. Previously, colleges were funded to deliver a defined number of Weighted Student Units of Measurement (WSUMs).
8 The simpler Credit-based system replaced WSUMs, and provides a clear separation between activity volume measures and Funding . Credit targets do not include subject weights, Extended Learning Support (ELS) claims, or full-time tariffs that were all part of the previous WSUM targets. This is explained further in Annex B. 5. This report focuses on trends in student numbers and activity targets. It also covers trends in full and part-time enrolments, and the make up of learning hours delivered by colleges. 6. This report shows trends in the level and mode of study of the sectors enrolments. These are presented in four groups: full-time higher education (HE), part-time HE, full-time further education (FE) and part-time FE.
9 Due to the additional reporting from colleges of the SCQF levels of courses, as defined by the SCQF level framework, the definition of higher education as qualifications at SCQF level 7 and above can be applied to courses delivered in the College sector. 7. This is part of ongoing improvement work around the reporting of qualifications and their level and is due to come in to full effect in academic year 2017-18, as stated in the FES 2 Guidance for 2017-18. This work began in 2016 -17, specifically looking at Scottish Vocational Qualifications (SVQ3s) and Advanced Highers. However, to allow continuity in the time series shown in this report, enrolments to these two qualifications have been defined as at Further Education level.
10 Further work with colleges and other colleagues will be undertaken to ensure continued improvement in this area. For more details please see Section 2: Trends in Student Numbers and Activity and Table F in Annex A. 8. Excel tables containing the background data to all the charts presented in this report can be found on the SFC website. 7 9. SFC s Infact database allows for more detailed analysis of provision within Scotland s colleges. More detail is in the Further Information section of this report. Trends in Student Numbers and Activity 10. This section focuses on trends across College provision from 2006-07 using headcount and enrolments and the volume of activity delivered at sector level.