Transcription of Commercial Banking Analysis FDIC Quarterly Banking Profile ...
1 Banking Watch 26 November 2015 Commercial Banking Analysis fdic Quarterly Banking Profile 2015 Q3 Filip Blazheski Positive Third Quarter but Profitability Remains Subdued as Risks Lurk Loans grew and earnings were up in the third quarter Asset quality is excellent and improving, but some signs of risk appear We expect these developments to continue in the coming period The federal Deposit insurance corporation ( fdic ) Quarterly Banking Profile (QBP) for 3Q15 shows that Commercial banks and savings institutions had a positive third quarter, as far as it is possible in today s challenging interest rate environment. The continuing modest growth of the economy resulted in loan portfolio growth, asset quality improvement, and an increase in net income.
2 However, interest and credit risks, although not large and imminent, started to become more apparent with the growing mismatch between asset and liability maturities, especially at community banks, and the growing lending in higher-risk loan categories such as leveraged Commercial borrowers. Martin Gruenberg, Chairman of the fdic , said: as history tells us it is during this phase of the credit cycle when lending decisions are made that could lead to future losses. Balance Sheet: Lending Posts Healthy Growth Total assets of Commercial banks and savings institutions went up by close to 3% on a year on year basis in Q3 - a continuation of the asset growth deceleration that started in the second quarter, driven by the slower growth in deposits .
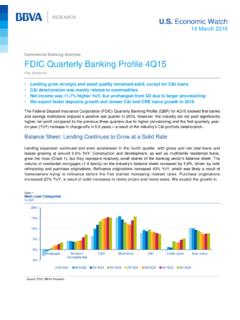
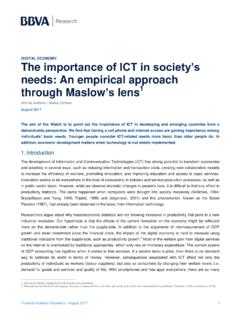
3 However, lending expansion continued with gross and net total loans and leases growing close to 6% year on year. Construction and development, and multifamily residential loans grew the most (Chart 1), but they are at the same time ones of the smaller loan categories (Chart 2). Residential mortgages (1-4 family) increased their growth slightly. Commercial and industrial (C&I) loans grew strongly on a year on year basis, but the growth is slowing somewhat. Chart 1 Main Loan Categories, Year-on-Year Change (Percent) Source: fdic , BBVA Research -40%-30%-20%-10%0%10%20%1-4 Family residential mortgagesNonfarm nonresidentialConstruction and developmentMultifamily residential real estateCommercial & industrial loansLoans to individuals Banking Watch 26 November 2015 Chart 2 Main Loan Categories, Share of Total Assets (Percent) Source: fdic , BBVA Research On the liabilities side, low interest rates pushed the share of time deposits even lower in Q3 (Chart 3).
4 Interestingly, noninterest-bearing deposits also decreased slightly in relative terms, offsetting partly the solid increase in the previous quarter. The capital ratios for the industry did not change significantly (Chart 4). Chart 3 Domestic Office deposits to Total Liabilities and Capital (Percent) Chart 4 Capital to Assets (Percent) Source: fdic , BBVA Research Source: fdic , BBVA Research Loan Performance: Very Satisfactory and Still Improving Looking at loans 30-89 days past due (Chart 5), there was an uptick in auto loans, credit cards and home equity lines of credit, but this is mostly due to their seasonal nature. 0%2%4%6%8%10%12%14%16%1-4 Family residential mortgagesNonfarm nonresidentialConstruction and developmentMultifamily residential real estateCommercial & industrial loansLoans to individuals0%5%10%15%20%25%30%35%40%45%5 0%2010Q42011Q12011Q22011Q32011Q42012Q120 12Q22012Q32012Q42013Q12013Q22013Q32013Q4 2014Q12014Q22014Q32014Q42015Q12015Q22015 Q3 Time depositsNon-time interest-bearing depositsNoninterest-bearing deposits -1%1%3%5%7%9%11%13%15%17%2010Q42 011Q12011Q22011Q32011Q42012Q12012Q22012Q 32012Q42013Q12013Q22013Q32013Q42014Q1201 4Q22014Q32014Q42015Q12015Q22015Q3 Tier 1 risk based capital (PCA definition)Total risk based capital (PCA definition)
5 Total equity capital Banking Watch 26 November 2015 Chart 5 Loans 30-89 Days Past Due (Rate, Percent) Source: fdic , BBVA Research The rate of non-current loans continued to decline for all loan categories, except for C&I loans, the rate of which despite still being very low has been growing since Q4 2014. All of the deterioration is concentrated in banks with assets larger than $1 billion, indicating that it might be related to the financing of larger projects rather than small enterprises, and might be related to the adverse environment in industries operating in more challenging environments, such as oil and gas. The fdic did voice concerns about the future performance of loans in regions exposed to the downturn in the oil and gas industry, especially loans to oil and gas explorers and producers.
6 Chart 6 Non-Current Loans (Rate, Percent) Source: fdic , BBVA Research Regarding interest rate risk, assets with maturities longer than three years now stand close to 33% of total assets, which is the highest level in a long time. Community banks are significantly more exposed to longer-term assets than average. While asset maturities have been trending up steadily, according to the fdic there has been no comparable increase in the share of longer-term funding. This leaves banks more vulnerable to the imminent increase in interest rates, as funding liabilities could reprice more quickly than asset yields. Family Residential Real EstateLoansAuto LoansCredit CardsHome Equity Lines of CreditConstruction and DevelopmentLoansReal Estate Loans Secured byNonfarm Nonresidential PropertiesCommercial & Industrial LoansReal Estate Loans Secured byMultifamily Residential Properties0%2%4%6%8%10%1-4 Family Residential Real EstateLoansHome Equity Lines of CreditConstruction and DevelopmentLoansCredit CardsReal Estate Loans Secured byNonfarm Nonresidential PropertiesCommercial & Industrial LoansReal Estate Loans Secured byMultifamily Residential PropertiesAuto Loans Banking Watch 26 November 2015 Quarterly Income.
7 Net Income Higher on Year on Year Basis Net interest income remained almost flat last quarter due to the low interest rate environment. As net noninterest income decreased and the provisions for losses in absolute value increased, net income ended up lower than in the quarter before (Chart 7). On a year on year basis, however, net income grew by 5% (Chart 8). Chart 7 Income Statement (Million $) Chart 8 Net Interest Income and Net Income (Year-on-Year Change, Percent) Source: fdic , BBVA Research Source: fdic , BBVA Research The major factors affecting earnings contributions were the increase in net interest income and the decrease in non-interest expense (Chart 9). The decrease in non-interest expense was a result of a significant decrease in litigation expenses at some of the largest banks.
8 This benefit is a one-off event, so in its absence going forward the gains will be smaller. Furthermore, the industry cannot count any more on the benefit of decreasing loss provisions, which have accounted for most of the profitability gains from 2010 to 2014. The annualized return on assets and return on equity (Chart 10) did not change much compared to previous quarters. Chart 9 Major Factors Affecting Earnings Contributions to Pre-Tax Earnings Growth ($ Billion) Chart 10 Return on Asset and Return on Equity (Percent) Source: fdic , BBVA Research Source: fdic , BBVA Research (100,000)(50,000)050,000100,000150,00020 0,000250,000 Net interest incomeProvision for loan and lease lossesNet noninterest incomeNet income-20%-10%0%10%20%30%40%50%60%70%Net interest incomeNet income(4)(3)(2)(1)0123456 Increase inNet InterestIncomeIncrease inRealizedGains onSecuritiesDecrease inNoninterestExpenseDecrease inNoninterestIncomeIncrease inLoan (RHS)RoA (LHS) Banking Watch 26 November 2015 What Can We Expect Going Forward?
9 As we expect an ongoing expansion of the economy, deposits and loans will continue to grow in the short- to mid-term. With the gradual lift-off of interest rates by the federal Reserve, there will be less pressure on the industry s net interest margins, but at the same time, net interest margins will remain strained as higher margin loans mature and are replaced with lower margin loans, and as fuding liabilities might reprice faster than asset yields. The yield curve has been flattening over the last year, which we expect not to be reversed in the short- to mid-term. All this will contribute to subdued financial performance of the industry. More risk-averse lending, the signs of which appeared in the most recent federal Reserve Survey of Senior Lending Officers (see recent publication), will further contribute to stagnant profitabiltiy, but also to stability in the industry.
10 DISCLAIMER This document was prepared by Banco Bilbao Vizcaya Argentaria s (BBVA) BBVA Research on behalf of itself and its affiliated companies (each BBVA Group Company) for distribution in the United States and the rest of the world and is provided for information purposes only. Within the US, BBVA operates primarily through its subsidiary Compass Bank. The information, opinions, estimates and forecasts contained herein refer to the specific date and are subject to changes without notice due to market fluctuations. The information, opinions, estimates and forecasts contained in this document have been gathered or obtained from public sources, believed to be correct by the Company concerning their accuracy, completeness, and/or correctness.