Transcription of Commuting by Public Transportation in the United States: 2019
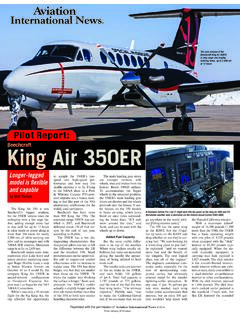
1 Commuting by Public Transportation in the United States: 2019 American Community Survey ReportsBy Michael Burrows, Charlynn Burd, and Brian McKenzieIssued April 2021 ACS-48 According to the American Community Survey (ACS), Public Transportation commuters constituted about 5 percent of all workers in the United States in Though Public Transportation (transit) was a relatively uncommon method of traveling to work in the United States as a whole, it played a prominent role in certain places, like the cities of New York, where over 2 million people commuted by Public Transportation , and San Francisco, where over one-third of workers did Trends in transit Commuting varied in 2019 by region, metropolitan area (metro), and certain notable demographic characteristics.
2 This report describes the status of Public transporta-tion Commuting in the United States, beginning with the distribution of Public Transportation commuters across different transit modes, proceeding to sum-marize key geographic and demographic patterns, and concluding with a glimpse at historical trends in Public Transportation . The 2019 ACS 1-year estimates collected Commuting data throughout calendar year 2019; therefore, these data necessarily reflect the sit-uation prior to the COVID-19 pandemic. These data will provide a baseline for understanding the impact of the pandemic and of the resulting economic crisis and recession that began in early 2020.
3 The Census Bureau reviewed this data product for unauthorized disclosure of confidential information and approved the disclosure avoidance practices applied to this release. CBDRB-FY20-POP001-0182. See 2019 American Community Survey 1-year estimates Table S0802 (with a geographic filter for New York) and S0801 (with a geographic filter for San Francisco).MEANS OF Transportation TO WORK IN THE ACSThe ACS is conducted annually by the Census Bureau to gather information about the socioeco-nomic, housing, and demographic characteristics of communities across the United The ACS asks respondents who worked in the last week about their primary means of Transportation to work.
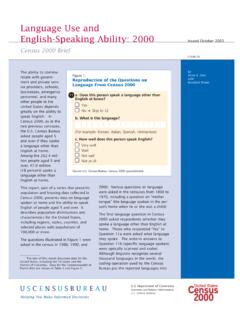
4 Respondents select from a list the method they used for the longest distance in their typical trip to work (Figure 1).4 The five Public Transportation modes included on this list: bus; subway or elevated rail; long-distance train or commuter rail; light rail, streetcar, or trol-ley; and ferryboat combined to form a group of about million people, or 5 percent of all workers in 2019 (Table 1). Public transporta-tion was less common than driving alone (reported by percent of workers), carpooling ( percent), and working from home ( percent). While driving alone and carpooling have been the two most common means of Transportation to work since the ACS began collecting Commuting information, the share of workers that worked from home first exceeded the share that commuted by Public Transportation in Estimates for Puerto Rico are not included in this report.
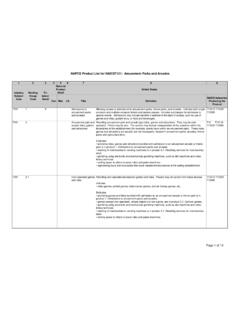
5 Public Transportation categories were updated in 2019 to better reflect contemporary nomenclature. More information on the update is available at < /library/working-papers/2017/ >.5 See 2017 American Community Survey 1-year estimates Table S0801 for these and other statistics about Commuting to work in the United Census BureauThe largest group of Public Transportation commuters ( percent of all Public transporta-tion commuters, or about million people) reported the bus as their primary commut-ing mode (Figure 2). Subway or elevated rail was the next most-common mode, at percent of Public Transportation com-muters.
6 Long-distance train or commuter rail carried per-cent of transit commuters, and percent traveled by light rail, streetcar, or trolley. The least-used mode of Public transit in 2019 was ferryboat, used by percent of transit commuters, or around 77,000 Transportation Commuting BY AGE AND SEX Commuting by Public trans-portation was somewhat more common in 2019 among women and younger workers. Women made up a smaller share of the overall workforce, but because a larger per-centage of women than men commuted by Public transpor-tation ( percent compared to percent), a roughly even quantity of men and women rode transit to work in Workers aged 25 to 29 com-muted to work by Public Transportation at relatively high percentages compared to other age groups (Figure 3).
7 About 7 percent of women aged 25 to 29 commuted by Public Transportation in 2019, higher than the percent of men in the same age group. Among workers aged 35 to 44, statistically even shares of men and women commuted 6 See 2019 American Community Survey 1-year estimates Table Public Transportation , but among workers aged 45 and over, the share of women com-muting by transit was consis-tently higher than men. Among both men and women, the share of workers Commuting by Public Transportation gener-ally declined with age, though more markedly for men than Figure on Travel Mode from the 2019 American Community SurveyNote: For more information, see < >.
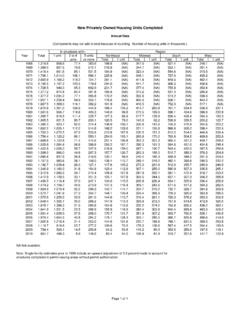
8 Source: Census Bureau, 2019 American Community Survey. Table 1 .Means of Transportation to Work in the United States: 2019(Workers 16 years and over. For information on confidentiality protection, sampling error, nonsampling error, and definitions, see < >)Means of transportationNumber Margin of error ( )PercentMargin of error ( )Total .. 156,941,346 161,399 , truck, or van .. 133,054,328 173,377 Drove alone.. 119,153,349 145,368 Carpooled .. 13,900,979 82,351 Transportation .. 7,778,444 42,450 Bus .. 3,601,403 34,897 Subway or elevated rail.
9 2,935,633 29,091 Long-distance train or commuter rail .. 921,391 1 7, 4 6 5 Light rail, streetcar, or trolley .. 242,776 8,667 Ferryboat .. 7 7, 2 41 5,055 ab .. 385,756 13,467 .. 221,923 7,7 8 5 .. 805,722 19,868 .. 4,153,050 43,355 means .. 1,571,323 2 7, 4 6 5 from home .. 8,970,800 53,611 : Census Bureau, 2019 American Community Survey, 1-year Census Bureau 3for women. For example, about the same percentage of women aged 45 to 49 as aged 60 to 64 commuted by Public trans-portation ( and percent, respectively, and not statistically different).
10 Across these same two age groups, the percentage of men Commuting by transit declined from to percent. Workers aged 65 and over com-muted by Public Transportation at the lowest percentages of any age group among both men and women ( and percent, respectively).VARIATION BY REGION AND COMMUNITY TYPEP ublic Transportation com-muting followed distinct geo-graphical patterns in 2019. In the Figure of Transportation to Work Among Transit Commuters: 2019 Note: Total may not sum to 100 due to rounding. For information on confidentiality protection, sampling error, nonsampling error, and definitions, see < >.