Transcription of Comprehensive Housing Market Analysis for New York City ...
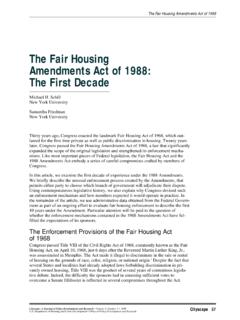
1 Comprehensive Housing Market ANALYSISNew york city , New Department of Housing and Urban Development Office of Policy Development and ResearchAs of July 1, 2015 New JerseyQueensBergenEssexNassauUnionPassai cHudsonWestchesterMiddlesexMonmouthMorri sNew JerseyNewYorkNew YorkQueensKingsBronxRichmondAtlantic OceanNew YorkHousing Market AreaThe new york city Housing Market Area (hereafter, the NYC HMA), which comprises the five boroughs of new york city (NYC), is part of the new york -Newark-Jersey city , NY-NJ-PA Metro-politan Statistical Area. For purposes of this Analysis , the HMA is divided into five submarkets: the Bronx (Bronx County), Brooklyn (Kings County), Manhattan ( new york County), Queens (Queens County), and Staten Island (Richmond County) submarkets. The HMA com-prises the largest city in the nation and is recognized as the financial center of the United During the past 4 years, the NYC HMA recorded the fastest rate of payroll growth in more than a decade.
2 The growth has been widespread, with most nonfarm sectors adding jobs during this time. The HMA has benefited from the improving national economy, increasing tourism, and its continued status as a hub for finance, trade, education, and health care. The HMA economy expanded rapidly during the 12 months ending June 2015, increasing by 112,600 jobs, or percent. Job growth is expected to continue during the next 3 years, although at a reduced average annual rate of percent. Table DP-1 at the end of this report provides employment data for the MarketThe sales Housing Market in the HMA is currently balanced. During the 12 months ending June 2015, home sales decreased 4 percent, to 46,100 homes, but the average price increased 12 per - cent, to $892,800 (Real Estate Board of new york [REBNY]). During the forecast period, demand is expected for approximately 16,000 new homes; the 4,095 homes currently under construction will meet a portion of that demand (Table 1).
3 Some of the 113,500 other vacant units in the HMA may reenter the Market and satisfy a portion of the MarketRental Market conditions among the five submarkets range from balanced to slightly tight. Apartment Market conditions range from balanced to tight. The apartment vacancy rate for the HMA in the second quarter of 2015 was percent, down from percent a year earlier (Reis, Inc.). The apartment Market has eased from tighter conditions in 2012 and 2013. The average rent rose 2 percent during the past 2 years to $3,374, and apartment production increased. During the forecast period, demand is expected for 50,175 new Market -rate rental units in the HMA; the 47,970 rental units currently under construction will meet most of the demand (Table 1). Housing Market SummarySubmarketSales MarketRental MarketBronxBalancedSlightly tightBrooklynBalancedBalancedManhattanSl ightly softBalancedQueensBalancedBalancedStaten IslandSlightly softBalancedSource: Assessments by analystsMarket DetailsEconomic Conditions.
4 2 Population and Households ..7 Housing Market Trends ..10 Data Profiles ..36 new york city , NY Comprehensive Housing Market ANALYSIS2 Table 1. Housing Demand in the new york city HMA During the Forecast PeriodNew york city HMAB ronx SubmarketBrooklyn SubmarketSales UnitsRental UnitsSales UnitsRental UnitsSales UnitsRental UnitsTotal demand16,00050,1756509,3507,30017,200 Under construction4,09547,970302,65058022,750 Manhattan SubmarketQueens SubmarketStaten Island SubmarketSales UnitsRental UnitsSales UnitsRental UnitsSales UnitsRental UnitsTotal demand2,8509,7754,20012,2001,0001,650 Under construction2,97510,50030011,500210570 Notes: Total demand represents estimated production necessary to achieve a balanced Market at the end of the forecast period. Units under construction as of July 1, 2015. A portion of the estimated 113,500 other vacant units in the HMA will likely satisfy some of the forecast demand.
5 The forecast period is July 1, 2015, to July 1, : Estimates by analystsEconomic ConditionsHistorically strong economic growth occurred in the NYC HMA during the past 4 years, with nonfarm payroll growth peaking at 120,700 jobs, or percent, in 2014 the fastest annual rate of growth and the most jobs added annually in the HMA since these data began to be reported in 1951. During the 12 months ending June 2015, strong nonfarm payroll growth continued in the HMA, although at a slightly reduced rate. Nonfarm payrolls increased by 112,600 jobs, or percent, to million jobs, during this time (Table 2).The HMA is a regional, national, and international hub for finance, trade, education, and health care. Of Fortune 500 companies, 48, or nearly 10 per - cent, are headquartered in the HMA, including 5 of the top 50 largest corpora - tions: Verizon Communications Inc., JPMorgan Chase & Co., Citigroup Inc.
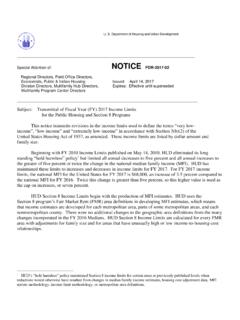
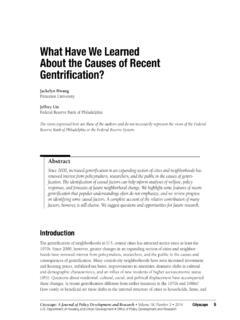
6 , MetLife, Inc., and AIG (American International Group, Inc.). Eight of the 10 largest employers in the HMA are in the education and health services sector, including Mount Sinai Hospital, with 32,056 employees, and Columbia University, with 15,601 employees (Table 3). The sector accounts for ap - proximately one in five jobs within the HMA (Figure 1).From 2004 through 2008, nonfarm payrolls in the HMA expanded by an average of 52,600 jobs, or percent, annually. Payroll growth during that time was fairly broad based. Growth occurred in all the service-providing Table 2. 12-Month Average Nonfarm Payroll Jobs in the new york city HMA, by Sector12 Months EndingAbsolute ChangePercent ChangeJune 2014 June 2015 Total nonfarm payroll jobs4,042,7004,155,300112, sectors201,000204,5003, , logging, & construction124,500129,4004, ,50075,100 1,400 sectors3,841,7003,950,800109, & retail trade487,900499,40011, & utilities123,500125,8002, ,300186,0002, activities443,400452,8009, & business services655,500681,20025, & health services829,700862,60032, & hospitality397,400413,70016, services177,100182,8005, ,000546,5002, : Numbers may not add to totals because of rounding.
7 Based on 12-month averages through June 2014 and June : Bureau of Labor StatisticsSummary ContinuedNew york city , NY Comprehensive Housing Market ANALYSIS3 Table 3. Major Employers in the new york city HMAName of EmployerNonfarm Payroll SectorNumber of EmployeesJPMorgan Chase & activities48,650 Mount Sinai HospitalEducation & health services32,056 new york -Presbyterian HospitalEducation & health services21,802 Montefiore Medical CenterEducation & health services18,030 NYU Langone Medical CenterEducation & health services17,879 Columbia UniversityEducation & health services15,601 New Partners Nurse Service of New YorkEducation & health services14,400 Consolidated EdisonTransportation & utilities13,280 Memorial Sloan Kettering Cancer CenterEducation & health services12,662 Notes: Excludes local school districts. Private employers only. Estimates as of : new york Department of Labor; ; Visiting Nurse Service of New YorkFigure 1.
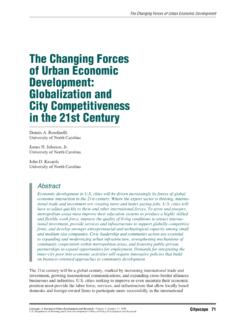
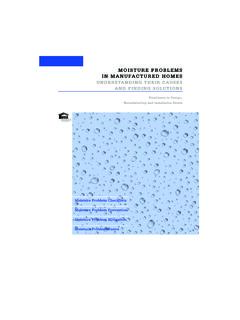
8 Current Nonfarm Payroll Jobs in the new york city HMA, by SectorNote: Based on 12-month averages through June : Bureau of Labor Statisticssectors, with average growth exceed-ing percent annually in all sectors except information and government. Manufacturing was the only sector to lose jobs during each of the years, declining by an average of 6,200 jobs, or percent, annually. The largest job gains occurred in the professional and business services, education and health services, and leisure and hospitality sectors, which increased by an average of 13,300, 12,300, and 10,000 jobs annually, or , , and percent, and accounted for approx - imately two-thirds of the total jobs added from 2004 through 2008. Steady job growth during that period led to a decline in the unemployment rate from percent in 2003 to percent in 2008 (Figure 2).The most recent recession, which lasted nationally from December 2007 through June 2009, did not last as long in the NYC HMA as in many other large metropolitan areas in the United States.
9 In part, the HMA escaped the recession more quickly because its economy was not as heavily reliant on construction-related jobs and because Figure 2. Trends in Labor Force, Resident Employment, and Unemploy- ment Rate in the new york city HMA, 2000 Through 2014 Source: Bureau of Labor StatisticsEconomic Conditions ContinuedGovernment services & hospitality & health services & business services & retail trade , logging, & construction & utilities activities rateLabor force and resident employment4,405,0004,205,0004,005,0003,8 05,0003,605,0003,405,0003,205,0003,005,0 00 Labor force Resident employment Unemployment rate york city , NY Comprehensive Housing Market ANALYSIS4the economy was buoyed by continued strength in the healthcare, leisure and hospitality, and technology industries. Nonfarm payrolls declined for one year, 2009, when 100,600 jobs, or percent of total nonfarm payrolls, were lost.
10 The only sectors to add jobs in 2009 were the education and health services and the government sectors, which increased by 15,900 and 2,900 jobs, or and percent, respectively. Declines, which occurred in most sectors, were concentrated primarily in those sectors most affected by the collapse of the nationwide Housing Market . More than three-fourths of the decline in nonfarm payrolls occurred in the professional and business ser - vices, financial activities, and mining, logging, and construction sectors, which declined by 34,100, 30,800, and 11,900 jobs, or , , and percent, re - spectively. The economic downturn led to a significant increase in the unem - ployment rate for the HMA from percent in 2008 to percent in 2009, the highest annual average unem - ployment rate in more than 10 2010, nonfarm payroll growth in the HMA resumed at a much-reduced rate relative to earlier in the decade, as continued weakness in manufacturing and Housing -related sectors was offset by modest growth elsewhere in the economy.