Transcription of Condensed Consolidated Statement of Comprehensive …
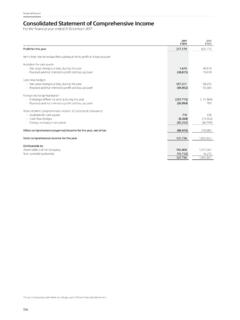
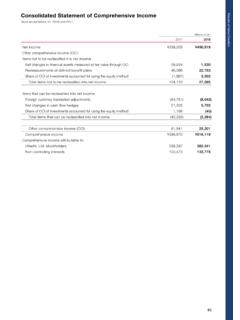
1 15 Condensed Consolidated Statement of Comprehensive income For the six months ended 30 June 2011 $m 2010 $m Revenue 16,722 16,754 Cost of sales (2,821) (3,106) Gross profit 13,901 13,648 Distribution costs (168) (166) Research and development (2,360) (2,311) Selling, general and administrative costs (5,376) (4,912) Other operating income and expense 369 418 Operating profit 6,366 6,677 Finance income 273 259 Finance expense (493) (500) Profit before tax 6,146 6,436 Taxation (1,108) (1,541) Profit for the period 5,038 4,895 Other Comprehensive income .
2 Foreign exchange arising on consolidation 246 (378) Foreign exchange differences on borrowings forming net investment hedges (113) 196 Amortisation of loss on cash flow hedge 1 1 Net available for sale gains/(losses) taken to equity 18 (5) Actuarial gain/(loss) for the period 156 (328) income tax relating to components of other Comprehensive income (6) 17 Other Comprehensive income for the period, net of tax 302 (497) Total Comprehensive income for the period 5,340 4,398 Profit attributable to: Owners of the parent 5,020 4,884 Non-controlling interests 18 11 5,038 4,895 Total Comprehensive income attributable to.
3 Owners of the parent 5,318 4,381 Non-controlling interests 22 17 5,340 4,398 Basic earnings per $ Ordinary Share $ $ Diluted earnings per $ Ordinary Share $ $ Weighted average number of Ordinary Shares in issue (millions) 1,389 1,448 Diluted weighted average number of Ordinary Shares in issue (millions) 1,395 1,454 16 Condensed Consolidated Statement of Comprehensive income For the quarter ended 30 June 2011 $m 2010 $m Revenue 8,430 8,178 Cost of sales (1,482) (1,452) Gross profit 6,948 6,726 Distribution costs (88) (88) Research and development (1,198) (1,320) Selling, general and administrative costs (2,868) (2,450) Other operating income and expense 171 166 Operating profit 2,965 3,034 Finance income 136 126 Finance expense (243) (243) Profit before tax 2,858 2,917 Taxation (735) (801) Profit for the period 2,123 2,116 Other Comprehensive income .
4 Foreign exchange arising on consolidation 38 (175) Foreign exchange differences on borrowings forming net investment hedges (21) 92 Amortisation of loss on cash flow hedge 1 1 Net available for sale gains/(losses) taken to equity 7 (5) Actuarial gain/(loss) for the period 174 (247) income tax relating to components of other Comprehensive income (33) 11 Other Comprehensive income for the period, net of tax 166 (323) Total Comprehensive income for the period 2,289 1,793 Profit attributable to: Owners of the parent 2,113 2,107 Non-controlling interests 10 9 2,123 2,116 Total Comprehensive income attributable to.
5 Owners of the parent 2,273 1,777 Non-controlling interests 16 16 2,289 1,793 Basic earnings per $ Ordinary Share $ $ Diluted earnings per $ Ordinary Share $ $ Weighted average number of Ordinary Shares in issue (millions) 1,381 1,445 Diluted weighted average number of Ordinary Shares in issue (millions) 1,387 1,450 17 Condensed Consolidated Statement of Financial Position At 30 Jun 2011 $m At 31 Dec 2010 $m At 30 Jun 2010 $m ASSETS Non-current assets Property, plant and equipment 6,832 6,957 6,824 Goodwill 9,877 9,871 9,846 Intangible assets 12,072 12,158 12,832 Derivative financial instruments 319 324 370 Other investments 218 211 193 Deferred tax assets 1,397 1,475 1,206 30,715 30,996 31,271 Current assets Inventories 2,021 1,682 1,689 Trade and other receivables 8,320 7,847 7,307 Other investments 679 1,482 1,964 Derivative financial instruments 3 9 - income tax receivable 1.
6 538 3,043 3,328 Cash and cash equivalents 9,613 11,068 9,088 Assets classified as held for sale* 517 - - 22,691 25,131 23,376 Total assets 53,406 56,127 54,647 LIABILITIES Current liabilities Interest-bearing loans and borrowings (372) (125) (1,275) Trade and other payables (8,513) (8,661) (7,362) Derivative financial instruments - (8) (201)
7 Provisions (1,097) (1,095) (947) income tax payable (3,660) (6,898) (6,519) Liabilities classified as held for sale* (196) - - (13,838) (16,787) (16,304) Non-current liabilities Interest-bearing loans and borrowings (9,210) (9,097) (9,043) Deferred tax liabilities (3,034) (3,145) (2,851) Retirement benefit obligations (2,354) (2,472) (3,478) Provisions (685)
8 (843) (491) Other payables (470) (373) (215) (15,753) (15,930) (16,078) Total liabilities (29,591) (32,717) (32,382) Net assets 23,815 23,410 22,265 EQUITY Capital and reserves attributable to equity holders of the Company Share capital 341 352 360 Share premium account 3,010 2,672 2,372 Other reserves 1,915 1,917 1,939 Retained earnings 18,340 18,272 17,420 23,606 23,213 22,091 Non-controlling interests 209 197 174 Total equity 23,815 23,410 22,265 * Assets and liabilities held for sale represent the assets and liabilities of Astra Tech (see Note 1).
9 18 Condensed Consolidated Statement of Cash Flows For the six months ended 30 June 2011 $m Restated 2010 $m Cash flows from operating activities Profit before taxation 6,146 6,436 Finance income and expense 220 241 Depreciation, amortisation and impairment 1,037 832 Increase in working capital and short-term provisions (1,053) (977) Other non-cash movements (236) 32 Cash generated from operations 6,114 6,564 Interest paid (282) (323) Tax paid (3,003) (1,474) Net cash inflow from operating activities 2,829 4,767 Cash flows from investing activities Movement in short-term investments and fixed deposits* 852 (483) Purchase of property, plant and equipment (381) (313) Disposal of property, plant and equipment 46 28 Purchase of intangible assets (294) (1,172) Disposal of intangible assets - 210 Purchase of non-current asset investments (6) (23) Disposal of non-current asset investments - 2 Acquisitions of business operations - (348) Interest received 85 77 Payments made by subsidiaries to non-controlling interests (16) (10) Net cash inflow/(outflow)
10 From investing activities 286 (2,032) Net cash inflow before financing activities 3,115 2,735 Cash flows from financing activities Proceeds from issue of share capital 340 193 Repurchase of shares for cancellation (2,544) (709) Repayment of loans - (717) Dividends paid (2,646) (2,367) Movement in derivative financial instruments* 41 (156) Movement in short-term borrowings 19 (27) Net cash outflow from financing activities (4,790) (3,783) Net decrease in cash and cash equivalents in the period (1,675) (1,048) Cash and cash equivalents at the beginning of the period 10,981 9,828 Amounts reclassified as held for sale (47) - Exchange rate effects 40 (36) Cash and cash equivalents at the end of the period 9,299 8,744 Cash and cash equivalents consists of: Cash and cash equivalents 9,613 9,088 Overdrafts (314) (344) 9,299 8,744 *2010 restated to reclassify $156m movement in derivative financial instruments associated with financing activities.
