Transcription of CONSUMER PRICE INDEX – CALIFORNIA
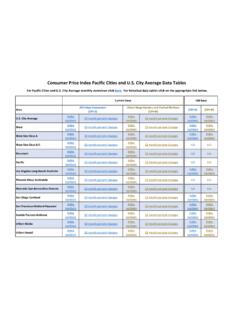
1 State of CALIFORNIA Office of the Director- Research Unit Department of Industrial Relations Box 420603, San Francisco, CALIFORNIA 94142 CONSUMER PRICE INDEX CALIFORNIA Los Angeles-Long Beach-Anaheim, San Francisco-Oakland-Hayward, San Diego-Carlsbad, Riverside-San Bernardino-Ontario, United States City Average, 2021-2022 All Items 1982 - 1984 = 100 All Urban Consumers, percentage (%) change from previous year Year Month Californiaa Los Angeles Long Beach Anaheimb San Francisco Oakland Haywardb San Diego Carlsbadb Riverside San Bernardino Ontariob City Averageb 2021 January N/A N/A 2021 February N/A N/A 2021 March N/A N/A 2021 April N/A N/A 2021 May N/A N/A 2021 June N/A N/A 2021 July N/A N/A 2021 August N/A N/A 2021 September N/A N/A 2021 October N/A N/A 2021 November N/A N/A 2021 December N/A N/A 2021 Annual Average 2022 January N/A N/A 2022 February N/A N/A 2022 March N/A N/A 2022 April N/A N/A 2022 May N/A N/A 2022 June N/A N/A 2022 July N/A N/A N/A N/A N/A N/A
2 2022 August N/A N/A N/A N/A N/A N/A 2022 September N/A N/A N/A N/A N/A N/A 2022 October N/A N/A N/A N/A N/A N/A 2022 November N/A N/A N/A N/A N/A N/A 2022 December N/A N/A N/A N/A N/A N/A 2022 Annual Average N/A N/A N/A N/A N/A N/A Date of last update: 8/10/2022 a Weighted average of the CONSUMER PRICE indexes for Los Angeles-Long Beach-Anaheim, San Francisco-Oakland-Hayward, San Diego-Carlsbad, and Riverside-San Bernardino-Ontario. A conversion factor has been included for comparability of 2018 data with 2017 and prior years. Computed by the Department of Industrial Relations, Office of the Director - Research Unit from indexes issued by the Department of Labor. b Source: Department of Labor, Bureau of Labor Statistics. Beginning with the November 2017 data, indexes for San Diego-Carlsbad will be published bi-monthly on odd months only (January, March, May, etc.)
3 The Riverside-San Bernardino-Ontario indexes are on a December 2017 = 100 base and will be published bi-monthly on odd months only (January, March, May, etc.). State of CALIFORNIA Office of the Director- Research Unit Department of Industrial Relations Box 420603, San Francisco, CALIFORNIA 94142 CONSUMER PRICE INDEX CALIFORNIA Los Angeles-Long Beach-Anaheim, San Francisco-Oakland-Hayward, San Diego-Carlsbad, Riverside-San Bernardino-Ontario, United States City Average, 2021-2022 All Items 1982 - 1984 = 100 Urban Wage Earners and Clerical Workers, percentage (%) change from previous year Year Month Californiaa Los Angeles Long Beach Anaheimb San Francisco Oakland Haywardb San Diego Carlsbadb Riverside San Bernardino Ontariob City Averageb 2021 January N/A N/A 2021 February N/A N/A 2021 March N/A N/A 2021 April N/A N/A 2021 May N/A N/A 2021 June N/A N/A 2021 July N/A N/A 2021 August N/A N/A 2021 September N/A N/A 2021 October N/A N/A 2021 November N/A N/A 2021 December N/A N/A 2021 Annual Average 2022 January N/A N/A 2022 February N/A N/A 2022 March N/A N/A 2022 April N/A N/A 2022 May N/A N/A 2022 June N/A N/A 2022 July N/A N/A N/A N/A N/A N/A
4 2022 August N/A N/A N/A N/A N/A N/A 2022 September N/A N/A N/A N/A N/A N/A 2022 October N/A N/A N/A N/A N/A N/A 2022 November N/A N/A N/A N/A N/A N/A 2022 December N/A N/A N/A N/A N/A N/A 2022 Annual Average N/A N/A N/A N/A N/A N/A Date of last update: 8/10/2022 a Weighted average of the CONSUMER PRICE indexes for Los Angeles-Long Beach-Anaheim, San Francisco-Oakland-Hayward, San Diego-Carlsbad, and Riverside-San Bernardino-Ontario. A conversion factor has been included for comparability of 2018 data with 2017 and prior years. Computed by the Department of Industrial Relations, Office of the Director - Research Unit from indexes issued by the Department of Labor. b Source: Department of Labor, Bureau of Labor Statistics. Beginning with the November 2017 data, indexes for San Diego-Carlsbad will be published bi-monthly on odd months only (January, March, May, etc.)
5 The Riverside-San Bernardino-Ontario indexes are on a December 2017 = 100 base and will be published bi-monthly on odd months only (January, March, May, etc.).