Transcription of CONTINGENT AND ALTERNATIVE EMPLOYMENT …
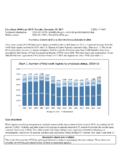
1 For release 10:00 (EDT) Thursday, June 7, 2018 USDL-18-0942 Technical information: (202) 691-6378 Media contact: (202) 691-5902 CONTINGENT AND ALTERNATIVE EMPLOYMENT ARRANGEMENTS MAY 2017 In May 2017, percent of workers million persons held CONTINGENT jobs, the Bureau of Labor Statistics reported today. These CONTINGENT workers are persons who do not expect their jobs to last or who report that their jobs are temporary. Using three different measures, CONTINGENT workers accounted for percent to percent of total EMPLOYMENT in May 2017. (See tables A and 1.)
2 In February 2005, the last time the survey was conducted, all three measures were higher, ranging from percent to percent of EMPLOYMENT . In addition to CONTINGENT workers, the survey also identified workers who have various ALTERNATIVE work arrangements. In May 2017, there were million independent contractors ( percent of total EMPLOYMENT ), million on-call workers ( percent of total EMPLOYMENT ), million temporary help agency workers ( percent of total EMPLOYMENT ), and 933,000 workers provided by contract firms ( percent of total EMPLOYMENT ). (See tables A and 5.) CONTINGENT work and ALTERNATIVE EMPLOYMENT arrangements are measured separately.
3 Some workers are both CONTINGENT and working in an ALTERNATIVE arrangement, but this is not automatically the case. The measures of CONTINGENT work and ALTERNATIVE EMPLOYMENT arrangements apply only to a person's sole or main job. For individuals with more than one job, this is the job in which they usually work the most hours. Note on New Questions in 2017 CONTINGENT Worker Supplement Four new questions were added to the May 2017 CONTINGENT Worker Supplement. These questions were designed to identify individuals who found short tasks or jobs through a mobile app or website and were paid through the same app or website.
4 BLS continues to evaluate the data from these new questions; the data do not appear in this news release. When available, additional information will be at Findings from this research will be published in a Monthly Labor Review article by September 30, 2018. -2- Table A. CONTINGENT workers and workers in ALTERNATIVE arrangements as a percent of total EMPLOYMENT , May 2 0 1 7 CONTINGENT workersPercent of total employedContingent workers are those who do not have an implicit or explicit contract for ongoing EMPLOYMENT . Persons who do not expect to continue in their jobs for personal reasons such as retirement or returning to school are not considered CONTINGENT workers, provided that they would have the option of continuing in the job were it not for these personal timate 1 Wag e and s alary work ers who expect their jobs will las t for an additional year or les s and who had worked at their jobs for 1 year or less.
5 Self-employed workers and independent contractors are excluded from this estimate. Temporary help and contract workers are included in this estimate based on the expected duration and tenure of their EMPLOYMENT with the temporary help or contract firm, not with the specific client to whom they are timate 2 Workers, including the self-employed and independent contractors, who expect their EMPLOYMENT to las t for an additional year or les s and who had work ed at their jobs (or been s elf-employed) for 1 year or less. Temporary help and contract workers are included in this estimate based on the expected duration and tenure with the client to whom they are assigned, instead of their tenure with the temporary help or contract timate 3 Work ers who do not expect their jobs to las t.
6 Wage and salary workers are included even if they already have held the job for more than 1 year and expect to hold the job for at least an additional year. The self-employed and independent contractors are included if they expect their EMPLOYMENT to last for an additional year or less and they had been self-employed or independent contractors for 1 year or EMPLOYMENT arrangementsIndependent contractorsWorkers who are identified as independent contractors, independent consultants, or freelance workers, regardless of whether they are self-employed or wage and salary workersWorkers who are called to work only as needed, although they can be scheduled to work for several days or weeks in a row.
7 Help agency workersWorkers who are paid by a temporary help agency, whether or not their job is temporary. provided by contract firmsWorkers who are employed by a company that provides them or their services to others under contract, are usually assigned to only one customer, and usually work at the customer s worksite. the Technical Note for the concepts and key questions used to identify these This information was obtained from the Current Population Survey (CPS), a monthly sample survey of about 60,000 households that provides data on EMPLOYMENT and unemployment in the United States.
8 Data on CONTINGENT and ALTERNATIVE EMPLOYMENT arrangements were collected periodically in supplements to the CPS from February 1995 to February 2005. The May 2017 supplement was sponsored by the Department of Labor's Chief Evaluation Office. Table A presents a summary of the three CONTINGENT worker estimates and four ALTERNATIVE EMPLOYMENT arrangements. The concepts and definitions used in the supplement are included in the Technical Note in this news release. Also see for answers to frequently asked questions. Highlights from the May 2017 data: Under the broadest measure of contingency, there were million CONTINGENT workers; these workers who did not expect their jobs to last accounted for percent of total EMPLOYMENT .
9 (See table 1.) CONTINGENT workers were more than twice as likely as noncontingent workers to be under age 25. They were also more than twice as likely as noncontingent workers to work part time. (See table 2.) Young CONTINGENT workers (16- to 24-year-olds) were much more likely than their noncontingent counterparts to be enrolled in school (62 percent and 36 percent, respectively). (See table 3.) CONTINGENT workers were more likely to work in professional and related occupations and in construction and extraction occupations than noncontingent workers. (See table 4.) More than half of CONTINGENT workers (55 percent) would have preferred a permanent job.
10 (See table 10.) In terms of ALTERNATIVE EMPLOYMENT arrangements, percent of all workers were independent contractors, percent were on-call workers, percent were temporary help agency workers, and percent were workers provided by contract firms. (See table A.) The demographic characteristics of workers in ALTERNATIVE EMPLOYMENT arrangements varied between the four arrangements. Compared to workers in traditional arrangements, independent contractors were more likely to be older, temporary help agency workers were more likely to be Black or Hispanic or Latino, and workers provided by contract companies were more likely to be men.