Transcription of Continuous Cooling Transformation (CCT) Diagrams
1 Continuous Cooling Transformation (CCT) DiagramsR. MannaAssistant ProfessorCentre of Advanced StudyDepartment of Metallurgical EngineeringInstitute of Technology, Banaras Hindu UniversityVaranasi-221 005, Steel-TRAERF Faculty Fellowship Visiting ScholarDepartment of Materials Science and MetallurgyUniversity of Cambridge, Pembroke Street, Cambridge, CB2 Cooling Transformation (CCT) diagramThere are two types of CCT diagramsI) Plot of (for each type of Transformation ) Transformation start, specific fraction of Transformation and Transformation finish temperature against Transformation time on each Cooling curveII)
2 Plot of (for each type of Transformation ) Transformation start, specific fraction of Transformation and Transformation finish temperature against Cooling rate or bar diameter for each type of Cooling medium2 Definition: Stability of phases during Continuous Cooling of austeniteDetermination of CCT diagram type , ( )isaustenitisedinaspeciallydesignedfurna ce( ) 1: Sample and fixtures for dilatometric measurements Fig. 2 : Dilatometer equipment4 Coolingdataareplottedastemperatureversus time( ).Dilationisrecordedagainsttemperature( ). TemperatureacbdFor a Cooling schedule TSTFFig. 3: Schematic Cooling curvesFig.
3 4: Dilation-temperature plot for a Cooling (orheating) (s). ,however, *100whereX,YandZareintersectionpointofte mperatureTlinetoextendedconstantslopecur veofaustenite(ba),transformationcurve(bc )andextendedconstantslopecurveoflowtempe raturephase(cd) (10%,20%,30%etc.) ,locusofstartpoints,isopercentagepointsa ndfinishpointsgivethetransformationstart line, (a)to(e) ,P,B,Mstandforferrite,pearlite, Sand F a schedulemartensitestartsatMSandfinishesa tMFandtherefore100% b b timeHVHVHVHVHVMM+BF+BF+BF+PFig. 5: Schematic dilatometric plots for five different Cooling rates where F, P, B and M stands for ferrite, pearlite, bainite and martensite respectively and subscript S and F stands for Transformation start and Transformation finish for respective products for a hypoeutectoid steelFig.
4 6: Schematic CCT diagram constructed from data of Fig 3(for the hypoeutectoid steel). Dotted line is 25% of total Transformation . abcde10 Incoolingschedule c c d e e two Cooling curves are considered equivalent if (i) the times to cool from Ae3to 500 C are same.(ii) the times to cool from Ae3 to a temperature halfway between Ae3and room temperature , are same.(iii) the Cooling rates are same.(iv) the instant Cooling rates at 700 C are same. Therefore to make it useful different types of CCT Diagrams need to be made following any one of the above schedule that matches with heat treatment Cooling test method for type I CCT diagramAnumberofJominyendquenchsamplesar efirstend-quenched( )foraseriesofdifferenttimesandtheneachof them(wholesample) , ,finishorspecificpercentageoftransformat iongenerateCCTdiagram( ).
5 131 (29 mm)diameter1 2 ( mm)1 ( mm) diameter ( mm) ( mm)4 (102 mm) long2 (64 mm)Free height of water jet ( mm) ( mm) diameter Fig 7(a): Jominy sample with fixture and water jet Water : Figures show (b) experimental set up, (c ) furnace for austenitisation, (d) end quenching process. Courtesy of DOITPoMS of Cambridge , Martensite finish temperatureM50,50% MartensiteMS,Martensite start temperatureMetastable austenite +martensiteMartensiteHardness, HRCT emperatureLog timeAe1to=Minimum incubation period at the nose of the TTT diagram, t o=minimum incubation period at the nose of the CCT diagramt0 AFEDCBD istance from quench endABCDEFJ ominy sampleMartensitePearlite+MartensiteFine pearlitepearliteCoarse.
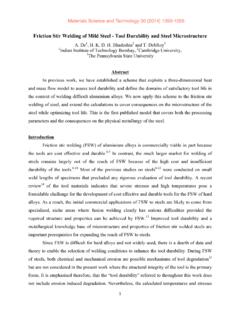
6 CCTdiagram()projectedonTTTdiagram()ofeut ectoidsteelt ,B,C,D,E, ,B,C,D,E, , s concept of fractional nucleation/progressive (1) (2)Thetransformationatatemperatureisnoti ndependenttocoolingaboveit.(3) t1/Z1+ t2/Z2+ t3/Z3+..+ tn/Zn=1 Where (1935).Thereactionsforwhichtheadditiveru leisjustifiiedarecalledisokinetic, (atb), , curve E just touches the nose of CCT diagram and that produces almost fully martensite. Cooling curve F avoid nose of C curve in CCT but touches the nose of TTT gives entirely martensite. Notice the critical Cooling rate to avoid nose of CCT diagram diffusional transformations is lower than that to TTT features of CCT diagrams1.
7 CCT diagram depends on composition of steel, nature of Cooling , austenite grain size, extent of austenite homogenising, as well as austenitisingtemperature and Similar to TTT Diagrams there are different regions for different Transformation ( cementite/ferrite, pearlite, bainiteand martensite). There are Transformation start and Transformation finish line and isopercentagelines. However depending on factors mentioned earlier some of the Transformation may be absent or some Transformation may be In general for ferrite, pearliteand bainitetransformation start and finish temperature moves towards lower temperature and Transformation time towards higher timing in comparison to isothermal Transformation .
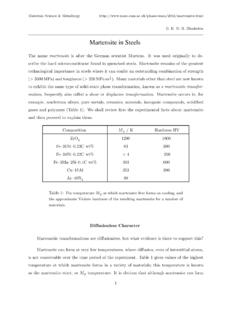
8 Transformation curve moves down and right. ,however,itcanbeloweredatlowercoolingrat eifcoolingcurvessuchthatausteniteenriche swithcarbonduetobainiteorferriteformatio n(inhypoeutectoidsteel).OntheotherhandMS cangoupforlowercoolingratesuchthatausten itebecomeleanincarbonduetocarbideseparat ion(inhypereutectiodsteel).247. Large variety of microstructure like ferrite/cementite/carbide +pearlite+bainite+martensite can be obtained in suitable Cooling rate. It is not feasible or limited in case of isothermal of type II CCT , , , (usuallyat700 C)in (inHRC) (fromtoptobottom), diameter, in mmAir cooledOil quenchWater quenchTemperature, CHardness, HRCH ardness, HVCooling rate at 700 C, C per minMs0%50%90%100%M50 MfM90 Fig.
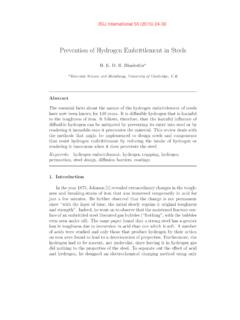
9 9: CCT diagram for hypoeutectoid steelHardness after Transformation at room temperature27 Conversion of TTT to CCT diagram, Scheil s method (1935) Scheil t1/Z1+ t2/Z2+ t3/Z3+..+ tn/Zn=1 Where of TTT to CCT, Grange and Kiefer Method (1941)Duringcontinuouscoolingalongagiven coolingcurvewhichinterceptstheTTTstartcu rveattemperatureT1,thetransformationwill startattemperatureT2,suchthatthetimeofco olingbetweenT1andT2isequaltothetimeforth estartoftransformationduringisothermalho ldingattemperatureT3=(T1+T2)/2( ).t3= ,however, timeT3=(T1+T2)/2and t3=t2-t1 or t2=(t1+t3)/2Ae3 Fig. 10: Graphic method of converting TTT diagram to CCT diagram [Grange and Kiefer method]30 Conversion of TTT to CCT, Avrami method (1939)Let TTT(T) be time required to obtain a given percentage of Transformation , X at temperature T during isothermal time required( CCT) to obtain the same percentage of Transformation , X, on Continuous Cooling at TCCTis given by the conditionX= Ae3 TCCTdX= Ae3 TCCT Ae3 TCCT g-dt-------1g-=time average Transformation rate (at any temperature T)=X/ IT(T).
10 Substituting this in equation 1 We get Ae3 TCCT dt/ TTT(T) =1--------2,By rewriting equation 2 we get Ae3 TCCT dT/( TTT(T) dT/dt)=1----------3 Both these integrals are called Avrami integral. Any one of these integrals has to be evaluated for each Cooling curve to get the CCT at TCCT31 Conversion of CCT to TTT diagram, Kirkaldy and Sharma method (1982)Let CCT(TCCT) be the time required to obtain a given percentage of Transformation , X at temperature TCCT during Continuous Cooling . If it is assumed that CCT diagram was constructed using constant Cooling rate(linear Cooling ),Then dT/dt=-(Ae3-TCCT)/( CCT(TCCT)----4 Substituting equation 4 in equation 3, cross multiplying and differentiating with respect to TCCTWe get TTT(TCCT)=1/(d/dTCCT[(Ae3-TCCT)/ CCT(TCCT)])---5 Where TTT is the time required for the given percentage Transformation , X, when carried out isothermally at rate of Cooling is not constant but Cooling rate can be expressed analytically or empirically as dT/dt=f1(x)f2(T)=f1(TCCT)f2(T) ---6(Exp.))