Transcription of Control Valve Sizing - CTi Controltech
1 3-1 Rev. 6/94 CONTENTSI ntroduction .. 3-1 Nomenclature .. 3-1 Calculating Cv for Liquids .. 3-3 Liquid Sizing Examples .. 3-7 Calculating Cv for Gases.. 3-10 Gas Sizing Examples .. 3-13 Calculating Cv for Two Phase Flow ..3-15 Vapor Pressure Charts .. 3A-1 Steam Tables ..3A-7 Fluid Property Correlation Constants ..3A-21 Pipe Data .. 3A-29 INTRODUCTIONV altek uses a systematic method for selecting bodytypes, sizes, materials, pressure ratings and trim sizesbased on flow Control Valve flow capacity (Cv) is based upon theindustry standard, ANSI/ISA This standardand the corresponding measuring standards containEquations used to predict the flow of compressible andincompressible fluids in Control valves.
2 Slightly differ-ent forms of the basic Equation are used for liquids steps for Sizing and selecting the correct valveinclude calculating the required Cv. Equations for calcu-lating Cv for both gases and liquids are found in has programmed the ANSI/ISA Sizing Equationsand procedures, making computer-aided Sizing avail-able on IBM-PC or compatible computers. Theseprograms permit rapid Control Valve flow capacity calcu-lations and Valve selection with minimal effort. Theprograms also include exit velocity, noise predictionand actuator Sizing calculations.
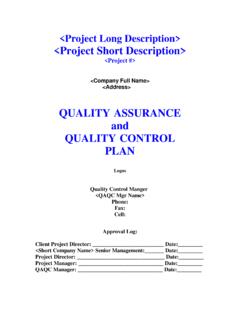
3 See Section 22 formore details on computer-aided Valve instructions are designed to expose the user tothe different aspects of Valve Sizing . The step-by-stepmethod outlined in this section is the most commonmethod of CapacityThe Valve Sizing coefficient most commonly used as ameasure of the capacity of the body and trim of a controlvalve is Cv. One Cvis defined as one gallon perminute of 60 degree Fahrenheit water that flows through(ValvePressureDrop)P1P2 PVC(Outlet Pressure)(Pressure at Vena Contracta)PPV(Vapor Pressure)a Valve with a one psi pressure drop.
4 The generalEquation for Cv is as follows: Cv= flow specific gravity at flowing temperaturepressure dropWhen selecting a Control Valve for an application, thecalculated Cv is used to determine the Valve size and thetrim size that will allow the Valve to pass the desired flowrate and provide stable Control of the process ProfileFluid flowing through a Control Valve obeys the basiclaws of conservation of mass and energy, and thecontinuity Equation. The Control Valve acts as a restric-tion in the flow stream. As the fluid stream approachesthis restriction, its velocity increases in order for thefull flow to pass through the restriction.
5 Energy forthis increase in velocity comes from a correspondingdecrease in velocity and minimum pressure occur imme-diately downstream from the throttling point at thenarrowest constriction of the fluid stream, known as thevena contracta. Downstream from the vena contracta,the fluid slows and part of the energy (in the form ofvelocity) is converted back to pressure. A simplifiedprofile of the fluid pressure is shown in Figure 3-1. Theslight pressure losses in the inlet and outlet passagesare due to frictional effects. The major excursions ofpressure are due to the velocity changes in the regionof the vena 3-1: Pressure Profile of FluidPassing Through a ValveControl Valve SizingSizing & Selection33-2 P/GfVolumetric Flow RateqmaxCV = q / P/Gf PchLiquid Pressure Recovery Factor, FLThe liquid pressure recovery factor, FL, predicts theamount of pressure recovery that will occur betweenthe vena contracta and the Valve outlet.
6 FL is anexperimentally determined coefficient that accounts forthe influence of the Valve s internal geometry on themaximum capacity of the Valve . It is determined fromcapacity test data like that shown in Figure also varies according to the Valve type. High recov-ery valves such as butterfly and ball valves havesignificantly lower pressures at the vena contracta andhence recover much farther for the same pressure dropthan a globe Valve . Thus they tend to choke (or cavitate)at smaller pressure drops than globe Critical Pressure Ratio Factor, FFThe liquid critical pressure ratio factor, FF, multiplied bythe vapor pressure, predicts the theoretical vena con-tracta pressure at the maximum effective (choked)pressure drop across the the downstream pressure is equal to or less than thevapor pressure, the vapor bubbles created at the venacontracta do not collapse, resulting in a liquid-gasmixture downstream of the Valve .
7 This is commonlycalled flashing. When flashing of a liquid occurs, theinlet fluid is 100 percent liquid which experiences pres-sures in and downstream of the Control Valve which areat or below vapor pressure. The result is a two phasemixture (vapor and liquid) at the Valve outlet and in thedownstream piping. Velocity of this two phase flow isusually very high and results in the possibility for erosionof the Valve and piping FlowChoked flow occurs in gases and vapors when the fluidvelocity reaches sonic values at any point in the valvebody, trim, or pipe. As the pressure in the Valve or pipeis lowered, the specific volume increases to the pointwhere sonic velocity is reached.
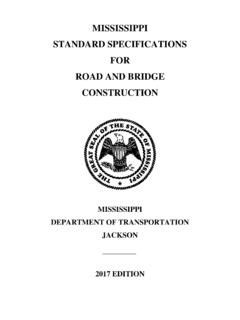
8 In liquids, vaporformed as the result of cavitation or flashing increasesthe specific volume of the fluid at a faster rate than theincrease in flow due to pressure differential. Loweringthe downstream pressure beyond this point in eithercase will not increase the flow rate for a constantupstream pressure. The velocity at any point in thevalve or downstream piping is limited to sonic(Mach = 1). As a result, the flow rate will be limited toan amount which yields a sonic velocity in the Valve trimor the pipe under the specified pressure 3 2: Choked Pressure DropAllowable Pressure DropThe capacity curve shown in Figure 3-2 shows that, withconstant upstream pressure, flow rate, q, is related tothe square root of pressure drop through the proportion-ality constant Cv.
9 The curve departs from a linearrelationship at the onset of "choking" described usingthe Fi factor. The flow rate reaches a maximum, qmax, atthe fully choked condition due to effects of cavitation forliquids or sonic velocity for compressible fluids. Thetransition to choked flow may be gradual or abrupt,depending on Valve design. ANSI/ISA liquid sizingEquations use a pressure recovery factor, FL, to calcu-late the Pch at which choked flow is assumed for sizingpurposes. For compressible fluids, a terminal pressuredrop ratio, xT, similarly describes the choked pressuredrop for a specific Sizing a Control Valve , the smallerof the actualpressure drop or the choked pressure drop is alwaysused to determine the correct Cv.
10 This pressure drop isknown as the allowable pressure drop, liquids, when the pressure anywhere in the liquiddrops below the vapor pressure of the fluid, vaporbubbles begin to form in the fluid stream. As the fluiddecelerates there is a resultant increase in pressure. Ifthis pressure is higher than the vapor pressure, thebubbles collapse (or implode) as the vapor returns to theliquid phase. This two-step mechanism calledcavitation produces noise, vibration, and causeserosion damage to the Valve and downstream onset of cavitation known as incipient cavitation is the point when the bubbles first begin to form andcollapse.