Transcription of Copper: Supply and Demand Dynamics - CME Group
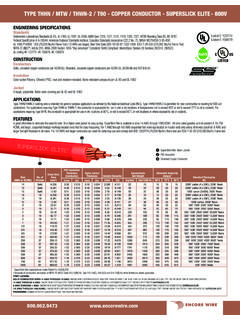
1 1 COMEX copper futures made headlines in early January by falling below $2/lb for the first time since 2009. The metal recently traded as much as 57% off its peak levels from 2011. This paper explores why copper prices have collapsed, and what might be in store for the metal in 2016 and , when people discuss copper , most of the focus is on the Demand side. Indeed, the slowdown in China, a major consumer of the metal, is a key reason why copper is under pressure. But, one must not overlook the Supply side. copper -mining Supply doubled between 1994 and 2014, and probably held steady or continued to grow in 2015. What s even more notable is that copper supplies might keep growing despite the collapse in prices, as they did in 2008-2010 when production rose about 3% despite the price plunge during the financial crisis (Figure 1).
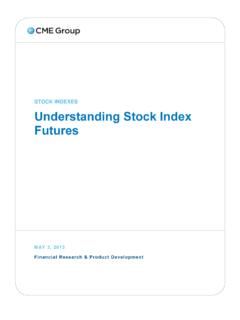
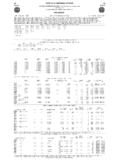
2 Figure 1: Mining Supply has doubled since Mining SupplySource: Geological Survey0 2000 4000 6000 8000 10000 12000 14000 16000 18000 20000 1994 1995 1996 1997 1998 1999 2000 2001 2002 2003 2004 2005 2006 2007 2008 2009 2010 2011 2012 2013 2014 Millions of Tons Supply Side Coppernomics: Increasing Supplies Cause Prices to SlideIt s no secret why mining Supply has increased so dramatically since 1994: mining copper is, or at least was, highly profitable. From 2011 to 2014, the total cost of producing one pound of copper hovered around $2. By comparison, prices averaged above $4 per lb in 2011, and over $3 per lb from 2012 to 2014. Even in 2015, copper prices averaged close to $ per lb, roughly 25% above the cost of production. Only now, at the beginning of 2016, have prices come down to what had been the all-in cost of production back in the 2011-2014 period (Figure 2).
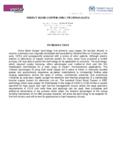
3 Figure 2: Production costs and selling prices in USD (cents) / Production Costs and Selling PricesSource: GFMS copper Survey 2013 and 2015, Bloomberg Professional (HG1),CME Group Economic Research Calculations0 50 100 150 200 250 300 350 400 450 2011 2012 2013 2014 2015 2016 USd Per Pound Average Selling Price for 2011 - 2015, opening price for 2016 Total Cost of Production Net Cash Cost ERIK NORLAND, SENIOR ECONOMIST AND EXECUTIVE DIRECTOR, CME GROUP27 JANUARY 2016 copper : Supply and Demand DynamicsAll examples in this report are hypothetical interpretations of situations and are used for explanation purposes only. The views in this report reflect solely those of the author and not necessarily those of CME Group or its affiliated institutions.
4 This report and the information herein should not be considered investment advice or the results of actual market s tempting to say that with copper prices as low as they are currently, that mining companies will cut back on production. But, the jury s still out. What complicates the analysis is the fact that we don t have production-cost numbers for 2015 yet, but there are three reasons to think that they fell significantly:1) The currencies of copper -producing nations have fallen dramatically: down in 2014 from 2013, and down by in 2015 from 2014 (see appendix for details). This should reduce the labor costs of producing copper across much of the copper mining world, not least of all in Chile, which supplies 31% of the world s copper ) Mining companies are cutting costs: from 2003 to 2014, the focus was mainly on adding production to keep pace with soaring Demand , notably from China.
5 With Demand growth tapering off, or even declining, the new focus will be on reducing unit cost of ) Energy prices have collapsed, and mining/refining copper is highly energy intensive. As such, our guess is that while investment in future copper production is likely to decline, potentially depressing mining production in the 2020s, copper production over the next several years is most likely to either flatline or increase further. Appendix:Which Financial and Commodity Market Forces Drive copper Prices?In order to answer this question, we did a simple regression analysis using 10 years worth of monthly price-change data for copper and regressing six different market factors:Figure 3:These six variables account for about 42% of the movement in copper prices over the period from January 2006 to December 2015 (Figure 3).
6 The strongest influence on copper , by far, is oil, as measured by West Texas Intermediate crude (WTI). A 10% rise (fall) in oil prices correlated with a rise (fall) in copper prices, with a standard deviation and given the other factors. Movements in the S&P 500 exerted the second strongest influence on copper : a 10% rise in the S&P tended to send copper prices about higher, on average, with a standard deviation, given the other factors. Chinese stocks, measured by the FTSE China A50, also had an influence but not as strongly. copper also correlates with the dollar (USD). A weak USD tends to mean higher copper prices and vice versa. Finally, copper exhibits a fairly modest, and, by most measures, not a statistically significant negative response to Fed rate factors go a long way toward explaining why copper has done so badly: oil prices have collapsed, USD has soared, equity prices have stagnated in the United States and fallen in China, and the Fed hiked rates for the first time in nearly a decade in December.
7 But what s the outlook going forward? Oil prices: We see oil prices as being in the process of forming a bottom, which is not the same as saying that they have already hit bottom. production may have peaked in 2015 and might begin to decline in 2016. The decline in North Sea production that began around the year 2000 will likely accelerate. Middle Eastern and Russian production will probably continue at full tilt, but potential geopolitical instability, especially in the Middle East and Venezuela, poses increasingly significant upside risks. 3 Just to reiterate, we see oil prices mainly as a Supply -side issue for copper . Mining and refining are both energy-intensive businesses. While oil isn t the only or even the main source of energy that these operations require, lower prices for crude and refined products will likely reduce the cost of operating mines and metals refining operations.
8 This will marginally boost Supply by reducing the breakeven point of copper businesses worldwide. Oil s impact on the Demand side is more mixed. It will hurt Demand in countries that are net oil exporters, including the Persian Gulf nations, Russia and parts of Latin America, and Africa. On the other hand, lower oil prices are likely to boost economic activity and, therefore, copper Demand in the non-oil exporting world, which accounts for roughly 86% of global GDP. China and the equity markets: While stocks exerted the strongest influence on copper prices during the period from 2006 to 2015 (on average), questions over the direction of Chinese stocks loom large in the copper market as we begin 2016. China has numerous challenges and its troubles boil down to a number of intermediate-to-long-term problems:1) China is beginning a structural slowdown as its productivity-enhancing rural-to-urban transition passes the half-way mark, and as its population ages.
9 2) China has exceptionally high levels of private sector debt (Figure 4), which are weighing on economic growth and hurting Chinese stocks, which have a very high weighting to the financial services sector (69% of the FTSE China A50 Index market capitalization). 3) The Renminbi is overvalued and probably needs to fall further ) China s growth model depends heavily on private and public investment spending, as well as exports. Exports have stalled while investment spending is earning increasingly low returns. China needs to boost consumer spending to replace its dependence on investment spending and exports, but doesn t appear to have a plan in place to help navigate the 4: China s Private Sector More Highly Leveraged Than its Emerging Market and Public Sector DebtSource: "Deleveraging, What Deleveraging?
10 " Buttiglione et al, International Center forMonetary and Banking Studies0 50 100 150 200 250 China Hungary Thailand Czech Republic Argentina South Africa Poland Turkey Brazil India Indonesia Mexico Russia Debt as a % of GDP Government Private The S&P 500 is a more complex picture. On the negative side, corporate earnings appear to have stalled and might start to decline. Declining earnings won t necessarily cause stocks prices to drop right away, but might eventually lead to a bear market or, at least, to greatly increased market volatility. Overall, the equity picture and its influence on copper might grow more negative as 2016 : For the reasons outlined above, the Chinese currency might fall quite dramatically versus USD in the coming months and could put other currencies under downward pressure as well.


![INDEX [www.brammerstandard.com]](/cache/preview/1/f/0/a/c/3/c/2/thumb-1f0ac3c27240c0d474cc8dff857cf096.jpg)