Transcription of Copy of How to Discredit Most Real Estate Appraisals in ...
1 Eugene Pasymowski, MAI RealStat Valuation Page 1 of 9 How to Discredit most real Estate Appraisals in One Minute By Eugene Pasymowski, MAI 2007 RealStat, Inc. Published in the TriState REALTORS Commercial Alliance Newsletter Spring 2007 real Estate Brokers have confidence but a real Estate appraiser must have evidence especially when serving as an expert witness. Unfortunately, in most instances real Estate appraisers make subjective, anecdotal, arbitrary, and unscientific adjustments to comparable sales market data without objective market-based support. Their valuation process relies on comparable building sales (Sales Comparison Approach), comparable rental rates (Income Capitalization Approach) and vacant land sales (Cost Approach).
2 Using these three approaches without disciplined statistical valuation methodology, these appraisers arrive at guesstimates of value. Guesswork is no longer an acceptable methodology in our advanced technological world. This paper will provide a simple mathematical test that can disprove most real Estate appraisal reports in one minute. This test, Verify Adjustments Tool, is a freeware program that can be downloaded from the RealStat website Appraisers have little or no training in statistics and econometrics (regression analysis) and thus violate two simple rules in statistics: 1. Sample size is too small 2. Variance in the real Estate market is not calculated The term econometrics literally means economic measurement.
3 It is the application of statistical analytical mathematical tools, mainly regression analysis, to the real world of economics. Its purpose is to: 1. Describe economic reality (via regression charts), 2. Test hypotheses about economic theory and significance of factors, and 3. Predict economic activity (estimate value of real Estate ). Eugene Pasymowski, MAI RealStat Valuation Page 2 of 9 Regression analysis is defined as: A method that examines the relationship between one or more independent variables (quantity) and a single dependent variable (price) by plotting points on a graph; used to identify and weight analytical factors and to make forecasts. Appraisal Institute. The Dictionary of real Estate Appraisal, 3rd Edition Appraisal Institute, 1993, Page 299.
4 Econometrics empowers real Estate appraisers to describe accurately the relationship between sale price and the various factors that contribute to the value of real Estate , test the significance of these factors, and apply the resultant econometric indicators to a credible estimate of value for a particular property. A scientific approach, it can be replicated to verify the appropriateness of the method used and to confirm the credibility of the estimated value. Econometrics and regression analysis are superior tools compared to so-called traditional (guesswork) appraisal techniques as summarized here: Methods:TraditionalRegressionNature of AnalysisSubjectiveObjectiveQuantificatio n of FactorsNoYesMarket Supported AdjustmentsNoYesHypothesis TestingNoYesCharts With Trend LinesNoYesReplication / Scientific TestingNoYesVariance CalculationNoYes Paired Sales AnalysisFalse Assumption: Perfect MarketNA Regression analysis is superior with regard to the comparable sales data selection.
5 The traditional methods contain a high potential for data bias, because the appraiser often engages in the highly questionable practice of data mining by selecting comparable sales to support a preconceived value conclusion. In contrast, regression relies on an unbiased random selection of comparable sales. Eugene Pasymowski, MAI RealStat Valuation Page 3 of 9 TraditionalRegressionTypes of Use SimilarSimilar(Residential, Commercial, Industrial, etc.)Property FeaturesSimilarDissimilar(Bedrooms, Bathrooms, Building Size, Ceiling Height, etc.)Data DiversityNarrowWideData Bias PotentialHighLowComparable Data Selection Criteria MethodTraditional AnalysisRegression AnalysisDATABIASEDUNBIASEDS election"Data Mining": Comparable sales selected to closely "match" the subject propertyRandom sample of sales from market a self fulfilling analysis is independent of the subject to support a from market transactions and then applied to subject Ethics ProvisionPossibly Misleading ReportMeaningful Report Regression analysis charts provide a visual image of the market.
6 The following is a step-by-step presentation of regression data charting. The regression line is drawn through the mathematical center of the data points. The subject property is plotted along the regression line. It is the estimated most probable price and hence the market value. The vertical price distance between the regression line and each data point is the price variance, the statistical residual. The total and the average of the statistical residuals must always equal zero because the regression line is drawn through the mathematical center of the all the data points. 2002 - 2004 RealStat , Inc18 PLOT SALES DATA POINTSD esign - Condition: Estimated Linear Trend Line$0$50,000$100,000$150,000$200,000$25 0,000$300,000$350,00001234567891011S ubject Property = $200,000 at Desi gn - Condi tion of Pasymowski, MAI RealStat Valuation Page 4 of 9 2002 - 2004 RealStat , Inc20 PLOT SUBJECT PROPERTYD esign - Condition: Estimated Linear Trend Liney = 16136x + 98342$0$50,000$100,000$150,000$200,000$2 50,000$300,000$350,00001234567891011 Subject Property = $200,000 at Design - Condition of $200,000 2002 - 2004 RealStat , Inc21 PLOT CONSTANT $98,342 Design - Condition.
7 Estimated Linear Trend Line$98,342y = 16136x + 98342$0$50,000$100,000$150,000$200,000$2 50,000$300,000$350,00001234567891011 Subject Property = $200,000 at Design - Condition of $200,000 2002 - 2004 RealStat , Inc19 DRAW REGRESSION TREND LINED esign - Condition: Estimated Linear Trend Line$0$50,000$100,000$150,000$200,000$25 0,000$300,000$350,00001234567891011 Subject Property = $200,000 at Design - Condition of Pasymowski, MAI RealStat Valuation Page 5 of 9 The regression formula is composed of the constant and the slope of the regression line. The constant is that point where the regression line intercepts with the price vertical axis, in this case $98,342. The slope increases at $16,136 per each unit x units = $101,658. Adding the constant of $98,382 plus the $101,658 equals the estimated market value of $200,000.
8 TEST 1: Sample Size The sample size (number of comparable sales) must be large enough to calculate the adjustment factors. Appraisers usually violate this rule. This simple mathematical proof is as follows: Sample size n minus 1 for the constant minus the number of factors = Remaining Degrees of Freedom (DF) that must always result in a positive number. Typical"N" SalesN - 1-# Adjustment Factors=Degrees of FreedomResidential32-7=-565-7=-276-7=-28 7-7= 098-7=+1-Regression3534-7=+ 27A smaller sample size with a positive degrees of freedom are permissible if the result achieves a statistically significant confidence & IndustrialSample Size "N" - 1 - Adjustment Factors = Degrees of FreedomSAMPLE SIZE FORMULAIt is mathematically impossible to estimate value when the degrees of freedom are less than one (1).
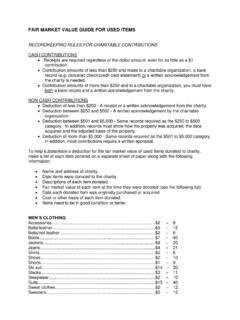
9 TEST 2: Variance real Estate is an imperfect marketplace and hence has a built-in variance. Two prioperties that are exactly alike in age, size, location, etc. that are sold on the same day will not sell for the same price because the real Estate market is an imperfect market that contains an inherent price variance. This is precisely why the appraisal profession exists to calculate the price variance. An appraiser is not needed to estimate the market price of fungible commodity such as gold since one gram of gold is equal in price and interchangeable with any other gram of gold. Eugene Pasymowski, MAI RealStat Valuation Page 6 of 9 The following table lists the rules necessary for a measure of variance. Here is a typical example of an appraisal report for a single-family home.
10 It relies on three comparable sales. The calculations look quite impressive. The appraiser made adjustments for eight factors (location, room count, gross living area, finished basement, heating & cooling, car garage, fireplace, and functional utility). Unfortunately, the sample size was too small indicating that the appraiser engaged in guesswork or simply made up the adjustments. 2002 - 2004 RealStat , Inc15 Variance The Missing AdjustmentIn The real Estate Market It Is AlwaysThere The Variance Must be Calculated. Typically It Is 10% to 30%. The Statistical Residual is the Measure of Variance. The Sum of Residuals = 0. The Average of the Residuals = 0. The Residual Must Be Added to Calculate the Correct Value Estimate.