Transcription of Copyright © 2018 Steiner Consulting Group, DLR …
1 Vol. 16, No. 65 / april 2, 2018 Sponsored in part by The Daily Livestock Report is published by Steiner Consulting Group, DLR Division, To subscribe, support or unsubscribe please visit The Daily Livestock Report is not owned, controlled, endorsed or sold by CME Group Inc. or its affiliates and CME Group Inc. and its affiliates disclaim any and all responsibility for the information contained herein. CME Group , CME and the Globe logo are trademarks of Chicago Mercantile Exchange, Inc. Disclaimer: The Daily Livestock Report is intended solely for information purposes and is not to be construed, under any circumstances, by implication or otherwise, as an offer to sell or a solicita-tion to buy or trade any commodities or securities whatsoever. Information is obtained from sources believed to be reliable, but is in no way guaranteed. No guarantee of any kind is implied or possible where projections of future conditions are attempted.
2 Futures trading is not suitable for all investors, and involves the risk of loss. Past results are no indication of future performance. Futures are a leveraged investment, and because only a percentage of a contract s value is require to trade, it is possible to lose more than the amount of money initially deposited for a futures position. Therefore, traders should only use funds that they can afford to lose without affecting their lifestyle. And only a portion of those funds should be devoted to any one trade because a trader cannot expect to profit on every trade. The Daily Livestock Report is made possible with support from readers like you. If you enjoy this report, find it valuable and would like to sustain it going forward, consider becoming a contributor. Just go to to contribute by credit card or send your check to The Daily Livestock Report, Box 4872, Manchester, NH 03018 Thank you for your support!
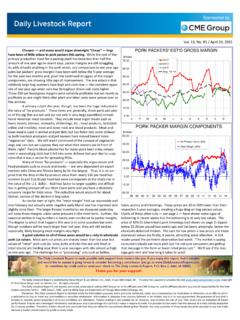
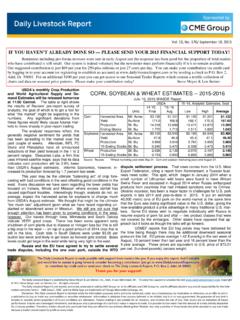
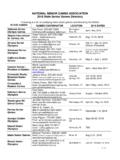
3 Copyright 2018 Steiner Consulting Group, DLR Division, Inc. All rights reserved. Prospective plantings was released by USDA-NASS on Thursday, March 29, 2018 articulating the intentions of crop farmers planting principle crops. Futures prices reacted to corn acres coming in at million acres, and soybeans at million acres. These figures were considerably lower than trade analyst s pre-report estimates which pegged both crops (see table to the right), but still within the range of estimates submitted. December corn futures closed $ per bushel higher on lower corn acres and September soybean futures moved 30 cents higher per bushel. Prospective plantings showed overall lower principle crop acres, down million acres. Corn and soybean acres are expected to decline broadly across many states both in the Midwest and other parts of the country. In the south, acres are expected to shift to cotton, which nationally is expected to gain 858,000 acres.
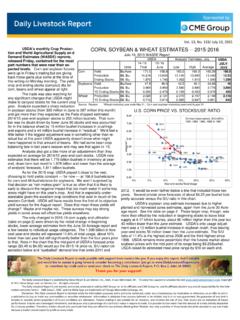
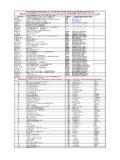
4 Spring wheat is also taking a few acres, up nationally. Planting intentions wasn t the only piece of new news to be had on Thursday. Quarterly Grain Stocks was also released by USDA-NASS and showed much higher stocks that last year for corn and beans. Corn stocks grew 3% or 266 million bushels compared to March 1, 2017, and was outside the upper range of pre-report estimates. Soybean stocks grew 368 million bushels year-over-year, up 21 percent from March 1, 2017. This is the largest March 1 stock number on record for corn and soybeans. Weekly grain exports show that disappearance through overseas marketing channels has been sluggish. Corn exports are down 28 percent current marketing year to date, and soybeans are down 12 percent, which in large part is pushing stock figures up. Plenty of soybeans and corn remain in the pipeline for domestic use for the remainder of this year but the lower acreage number has markets reacting to tightening supplies in the future, particularly if exports remain slow.
5 For the livestock sector, ample and relatively inexpensive feedstuffs has allowed for profitable expansion in recent years across cattle, hogs, and poultry sectors. Moving acreage lower to these levels is unlikely to put these sectors in check, because normal yields and current stock levels will likely keep price levels close to long-term season averages. In other words, it will take more than these lower acres to see substantial price increases in corn and beans, such as drought associated with significant yield drag, or exports remaining on the sidelines for an extended period of time. Quarterly Grain Stocks - March 1, 2018 USDA-NASS Grain Pre Report EstimatesAverage EstimatesUSDA ReportMar. 1 2018 Mar. 1 : Various News ServicesReutersMillion BushelsCornSoybeans SourceUSDA 2018 March trade trade trade outlook forum 2018 planted 2018 Prospective Plantings, Actuals and Estimatesmillions of acresSource: Reuters & USDA-NASS02,0004,0006,0008,00010,0001943 1947195119551959196319671971197519791983 19871991199519992003200720112015Mi l l i ons 1st Grain StocksCornSoybeansSource:USDA NASSVol.
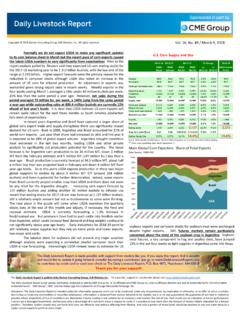
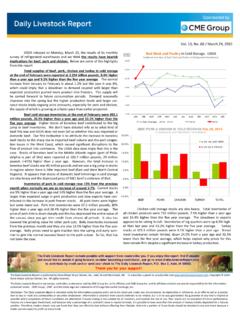
6 16, No. 65 / april 2, 2018 Sponsored in part by The Daily Livestock Report is made possible with support from readers like you. If you enjoy this report, find it valuable and would like to sustain it going forward, consider becoming a contributor. Just go to to contribute by credit card or send your check to The Daily Livestock Report, Box 4872, Manchester, NH 03018 Thank you for your support! Copyright 2018 Steiner Consulting Group, DLR Division, Inc. All rights reserved. PRODUCTION & PRICE SUMMARYWeek EndingSource: Various USDA Agricultural Marketing Service (Market News) reports. DATA ARE WeekLast WeekPct. ChangeLast YearPct. ChangeYTDY/Y % Change31-Mar-1824-Mar-181-Apr-17 Beef, Pork, Chicken, & Turkey Mil Lbs., cwe 1,837 1,870 1,820 ,176 Sl aughterThou. , Cow Sl aughter **Thou. , Dres s ed Wei ghtLbs . Producti onMi l l i on Lbs.
7 , ve Fed Steer Pri ce, 5-Mkt$ per s ed Steer Pri ce, 5-Mkt$ per ahoma Steer (600-700 l bs )$ per ce Beef Cutout$ per de/Offal$ per cwt, l i ve b, Pri mal , Choi ce$ per , Pri mal , Choi ce$ per , Pri mal , Choi ce$ per mmi ngs , 50%, Fres h$ per mmi ngs , 90%, Fres h$ per Sl aughterThou. Head2,3912, , , Sow Sl aughter **Thou. , Dres s ed Wei ghtLbs . Producti onMi l l i on Lbs . , Mi nn. Di rectWtd.. Bas e Carcas s Pri ceWtd.. Net Carcas s Pri ceWtd. Cutout$ per Val ue$ per cwt, l i ve , Pri mal$ per n, Pri mal$ per l y, Pri mal$ per mmi ngs , 72%, Fres h$ per Chi cken Sl aughter *Mi l l i on , Wei ght (RTC)Lbs . Chi cken Producti on (RTC)Mi l l i on Lbs . , Set (US)Mi l l i , cks Pl aced (US)Mi l l i on , onal Compos i te Whol e Bi rdCompos i t Breas t, B/S$ per t Leg Quarters$ per Turkey Sl aughter *Mi l l i on Wei ght (RTC)Lbs.
8 Producti on (RTC)Mi l l i on Lbs . , onal Hen (8-12 Lbs )$ per , Omaha$ per Bus s ti l l ers Grai n, Chi cago$ per , Kans as Ci ty (del i vered)$ per Bus , Cntrl IL$ per Bus Meal 48%, Cntrl IL$ per * Chi cken & turkey s l aughter & producti on are 1 week earl i er than the date at the top of thi s s heet.** Cow and s ow s l aughter refl ect l evel s from two weeks ago (part of 'actual " rather than "prel i mi nary" weekl y s l aughter report).3/31/ 2018