Transcription of Cost and Performance Characteristics of New Generating ...
1 Energy Information Administration | Cost and Performance Characteristics of New Generating Technologies, Annual Energy Outlook 2018 1 February 2018 Cost and Performance Characteristics of New Generating Technologies, Annual Energy Outlook 2018 The tables presented below will be incorporated in the electricity market Module chapter of the AEO2018 Assumptions document. Table represents EIA s assessment of the cost to develop and install various Generating technologies used in the electric power sector. Generating technologies typically found in end use applications, such as combined heat and power or roof top photovoltaics (PV), will be described elsewhere in the Assumptions document. The costs shown in Table , except as noted below, represent costs for a typical facility for each Generating technology before adjusting for regional cost factors. Overnight costs exclude interest accrued during plant construction and development. Technologies with limited commercial experience may include a Technological Optimism factor to account for the tendency during technology research and development to underestimate the full engineering and development costs for new technologies.
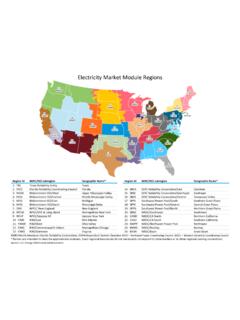
2 All technologies demonstrate some degree of variability in cost based on project size, location, and access to key infrastructure (such as grid interconnections, fuel supply, and transportation). For wind and solar PV in particular, the cost favorability of the lowest cost regions compound the underlying variability in regional cost and create a significant differential between the unadjusted costs and the capacity weighted average national costs as observed from recent market experience. To correct for this, Table shows a weighted average cost for both wind and solar PV based on the regional cost factors assumed for these technologies in the AEO2018 and the actual regional distribution of the builds that occurred in 2016. For AEO2018, the electricity model includes two solar PV technologies, one using single axis tracking technology and the other using fixed tilt arrays. Table presents a full listing of the overnight costs for each technology and electricity region ( ), if the resource or technology is available to be built in the given region.
3 The regional costs reflect the impact of locational adjustments, including one to address ambient air conditions for technologies that include a combustion turbine and one to adjust for additional costs associated with accessing remote wind resources. Temperature, humidity and air pressure can impact the available capacity of a combustion turbine, and EIA s modeling addresses this through an additional cost multiplier by region. Unlike most other generation technologies where fuel can be transported to the plant, wind generators must be located in areas with the best wind resources. As sites near existing transmission, with access to a road network, or otherwise located on lower development cost lands are utilized, additional costs may be incurred to access sites with less favorable Characteristics . EIA represents this through a multiplier applied to the wind plant capital costs that increases as the best sites in a given region are developed. Energy Information Administration | Cost and Performance Characteristics of New Generating Technologies, Annual Energy Outlook 2018 2 Table Cost and Performance Characteristics of new central station electricity Generating technologies Technology First available year1 Size (MW) Lead time (years) Base overnight cost (2017 $/kW) Project Contin gency Factor2 Techno logical Optimism Factor3 Total overnight cost4,10 (2017 $/kW) Variable O&M5 (2017 $/MWh) Fixed O&M (2017$/ kW/yr) Heat rate6 (Btu/kWh) nth of a kind heat rate (Btu/kWh) Coal with 30% carbon sequestration (CCS) 2021 650 4 4,641 5,089 9,750 9,221 Coal with 90% CCS 2021 650 4 5,132 5,628 11,650 9,257 Conv Gas/Oil Combined Cycle (CC)
4 2020 702 3 935 982 6,600 6,350 Adv Gas/Oil CC 2020 429 3 1,026 1,108 6,300 6,200 Adv CC with CCS 2020 340 3 1,936 2,175 7,525 7,493 Conv Combustion Turbine7 2019 100 2 1,054 1,107 9,880 9,600 Adv Combustion Turbine 2019 237 2 648 680 9,800 8,550 Fuel Cells 2020 10 3 6,192 7,132 9,500 6,960 Adv Nuclear 2022 2,234 6 5,148 5,946 10,460 10,460 Distributed Generation Base 2020 2 3 1,479 1,553 8,969 8,900 Distributed Generation Peak 2019 1 2 1,777 1,866 9,961 9,880 Battery Storage 2018 30 1 2,067 2,170 N/A N/A Biomass 2021 50 4 3,584 3,837 13,500 13,500 Geothermal8,9 2021 50 4 2,615 2,746 9,271 9,271 MSW Landfill Gas 2020 50 3 8,170 8,742 18,000 18,000 Conventional Hydropower9 2021 500 4 2,634 2,898 9,271 9,271 Wind10 2020 100 3 1,548 1,657 9,271 9,271 Wind Offshore8 2021 400 4 4,694 6,454 9,271 9,271 Solar Thermal8 2020 100 3 3,952 4,228 9,271 9,271 Solar PV tracking8, 11 2019 150 2 2,004 2,105 9,271 9,271 Solar PV fixed tilt8,11 2019 150 2 1,763 1,851 9,271 9,271 1 Represents the first year that a new unit could become operational.
5 2 AACE International, the Association for the Advancement of Cost Engineering, has defined contingency as An amount added to an estimate to allow for items, conditions, or events for which the state, occurrence, or effect is uncertain and that experience shows will likely result, in aggregate, in additional costs. 3 The technological optimism factor is applied to the first four units of a new, unproven design and reflects the demonstrated tendency to underestimate actual costs for a first of a kind unit. 4 Overnight capital cost including contingency factors, excluding regional multipliers (except as noted for wind and solar PV) and learning effects. Interest charges are also excluded. These represent current costs for plants that would come online in 2018. 5 O&M = Operations and maintenance. 6 For hydropower, wind, solar and geothermal technologies, the heat rate shown represents the average heat rate for conventional thermal generation as of 2016. This heat rate is used for purposes of calculating primary energy consumption displaced for these resources, and does not imply an estimate of their actual energy conversion efficiency.
6 The nuclear average heat rate is the weighted average tested heat rate for nuclear units as reported on the Form EIA 860, "Annual Electric Generator Report." No heat rate is reported for battery storage because it is not a primary conversion technology; conversion losses are accounted for when the electricity is first generated; electricity to storage losses are accounted for through the additional demand for electricity required to meet load. 7 Conventional combustion turbine units can be built by the model prior to 2018 if necessary to meet a given region's reserve margin. 8 Capital costs are shown before investment tax credits are applied. 9 Because geothermal and hydropower cost and Performance Characteristics are specific for each site, the table entries represent the cost of the least expensive plant that could be built in the Northwest Power Pool region, where most of the proposed sites are located. 10 Wind and both solar PV technologies' total overnight cost shown in the table represents the average input value across all 22 electricity market regions , as weighted by the respective capacity of that type installed during 2016 in each region to account for the substantial regional variation in wind and solar costs (as shown in Table ).
7 The input value used for wind in AEO2018 was $1,887 per kilowatt (kW), for solar PV with tracking was $2,207/kW, and for solar PV fixed tilt was $2,068, representing the cost of building a plant excluding regional factors. Region specific factors contributing to the substantial regional variation in cost include differences in typical project size across regions , accessibility of resources, and variation in labor and other construction costs through the country. 11 Costs and capacities are expressed in terms of net AC power available to the grid for the installed capacity. Source: Input costs are consistent with those used in AEO2017, and are primarily based on a report provided by external consultants, which can be found here: The base costs above reflect calculated learning cost reductions based on recent builds occuring since the cost report was provided. The cost differential between the two PV technologies was based on Lawrence Berkeley National Lab's Utility Scale Solar Report.
8 Hydropower site costs for non powered dams were updated for AEO2018 using data from Oak Ridge National Lab. Energy Information Administration | Cost and Performance Characteristics of New Generating Technologies, Annual Energy Outlook 2018 3 Table Total overnight capital costs of new electricity Generating technologies by region 2017 $/kW Technology 1 (ERCT) 2 (FRCC) 3 (MROE) 4 (MROW) 5 (NEWE) 6 (NYCW) 7 (NYLI) 8 (NYUP) 9 (RFCE) 10 (RFCM) 11 (RFCW) Coal with 30% CCS 4,560 4,764 5,034 4,893 5,334 N/A N/A 4,967 5,563 5,059 5,140 Coal with 90% CCS 5,043 5,268 5,549 5,409 5,867 N/A N/A 5,493 6,112 5,594 5,668 Conv Gas/Oil Combined Cycle (CC) 899 928 937 959 1,091 1,583 1,583 1,109 1,162 981 1,006 Adv Gas/Oil CC 1,062 1,084 1,052 1,095 1,230 1,687 1,687 1,250 1,300 1,099 1,145 Adv CC with CCS 2,030 2,106 2,115 2,092 2,227 3,173 3,173 2,239 2,379 2,131 2,190 Conv Combustion Turbine 1,063 1,104 1,052 1,095 1,149 1,558 1,558 1,134 1,217 1,096 1,122 Adv Combustion Turbine 661 683 655 683 737 1,054 1,054 732 794 682 703 Fuel Cells 6,683 6,847 7,168 6,953 7,196 8,644 8,644 7,096 7,325 7,125 7,111 Adv Nuclear 5,702 5,785 5,987 5,860 6,195 N/A N/A 6,291 6,356 5,940 6,059 Distributed Generation Base 1,382 1,423 1,524 1,519 1,775 2,537 2,537 1,797 1,859 1,577 1,594 Distributed Generation Peak 1,792 1,862 1,773 1,846 1,938 2,628 2,628 1,912 2,052 1,849 1,892 Battery Storage 2,126 2,143 2,168 2,163 2,201 2,543 2,543 2,163 2,221 2,168 2,173 Biomass 3,538 3,638 3,910 3,714 3,952 4,708 4,708 3,968 4,086 3,818 3,875 Geothermal N/A N/A N/A N/A N/A N/A N/A N/A N/A N/A N/A MSW Landfill Gas 8,043 8,296 8,812 8.
9 465 8,821 11,015 11,015 8,733 9,030 8,716 8,689 Conventional Hydropower N/A 5,165 N/A 1,694 1,904 N/A N/A 3,896 4,047 N/A 3,527 Wind 1,573 N/A 2,371 1,604 2,510 N/A 2,725 2,246 2,132 2,475 1,817 Wind Offshore 5,893 6,454 6,493 6,524 6,622 8,268 8,268 6,396 6,622 6,422 6,493 Solar Thermal 3,603 3,831 N/A N/A N/A N/A N/A N/A N/A N/A N/A Solar PV tracking 2,220 1,798 2,114 1,917 2,471 3,282 2,103 1,988 2,333 3,050 2,020 Solar PV fixed tilt 2,081 1,685 1,982 1,797 2,316 3,076 1,970 1,863 2,186 2,859 1,893 4,560 4,764 5,034 4,893 5,334 N/A N/A 4,967 5,563 5,059 5,140 Technology 12 (SRDA) 13 (SRGW) 14 (SRSE) 15 (SRCE) 16 (SRVC) 17 (SPNO) 18 (SPSO) 19 (AZNM) 20 (CAMX) 21 (NWPP) 22 (RMPA) Coal with 30% CCS 4,642 5,171 4,601 4,652 4,489 4,896 4,759 4,942 5,665 5,008 4,876 Coal with 90% CCS 5,139 5,713 5,088 5,144 4,958 5,409 5,262 5,459 6,230 5,527 5,375 Conv Gas/Oil Combined Cycle (CC) 896 1,018 923 901 874 973 938 1,072 1,237 1,021 1,149 Adv Gas/Oil CC 1,059 1,158 1,087 1,080 1,039 1,123 1,099 1,312 1,414 1,205 1,354 Adv CC with CCS 2,047 2,251 2,061 2,017 1,974 2,164 2,100 2,461 2,539 2,250 2,443 Conv Combustion Turbine 1,077 1,143 1,107 1,058 1,047 1,118 1,096 1,278 1,271 1,159 1,330 Adv Combustion Turbine 670 713 700 658 656 697 685 807 818 727 977 Fuel Cells 6,747 7,253 6,718 6,761 6,647 6,982 6,861 7,032 7,453 7,054 6,832 Adv Nuclear 5,738 6,035 5,720 5,749 5,684 5,874 5,803 5,904 N/A 5,963 5,946 Distributed Generation Base 1,389 1,605 1,417 1,407 1,356 1,513 1,459 1,553 1,931 1,567 1,636 Distributed Generation Peak 1,816 1,928 1,866 1,784 1,765 1,886 1,848 2,154 2,143 1,954 2,243 Battery Storage 2,139 2,191 2,134 2,137 2,126 2,159 2,146 2,160 2,254 2,177 2,149 Biomass 3,568 3,902 3,549 3,584 3,503 3,733 3,668 3,837 4,129 3,845 3,591 Geothermal N/A N/A N/A N/A N/A N/A N/A 4,070 2,802 2,746 N/A MSW Landfill Gas 8,156 8,908 8,086 8.
10 156 7,964 8,523 8,322 8,585 9,223 8,585 8,279 Conventional Hydropower N/A N/A 4,323 1,366 1,993 1,802 N/A 3,435 3,500 2,898 3,460 Wind 2,217 1,625 2,217 2,217 2,046 1,527 1,567 2,869 2,205 1,824 1,663 Wind Offshore 6,454 N/A 5,931 N/A 5,828 N/A N/A N/A 6,732 6,557 N/A Solar Thermal N/A N/A N/A N/A N/A N/A 3,878 4,152 4,727 4,178 3,894 Solar PV tracking 1,917 1,673 1,684 1,423 1,762 1,473 1,904 2,266 2,383 1,493 1,957 Solar PV fixed tilt 1,797 1,568 1,578 1,333 1,651 1,381 1,785 2,124 2,233 1,399 1,834 Costs include contingency factors and regional cost and ambient conditions multipliers. Interest charges are excluded. The costs are shown before investment tax credits are applied. N/A: Not available; plant type cannot be built in the region due to lack of resources, sites or specific state legislation. electricity market Module region map.