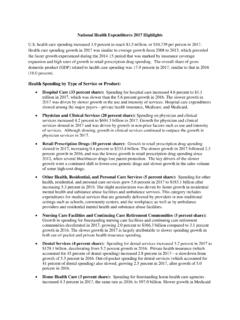
Transcription of Costs of Major U.S. Wars
1 CRS report for CongressPrepared for Members and Committees of Congress Costs of Major Wars Stephen Daggett Specialist in Defense Policy and Budgets June 29, 2010 congressional research Service7-5700 RS22926 Costs of Major Wars congressional research Service Summary This CRS report provides estimates of the Costs of Major wars from the American Revolution through current conflicts in Iraq, Afghanistan, and elsewhere. It presents figures both in current year dollars, that is, in prices in effect at the time of each war, and in inflation-adjusted constant dollars updated to the most recently available estimates of FY2011 prices. All estimates are of the Costs of military operations only and do not include Costs of veterans benefits, interest paid for borrowing money to finance wars, or assistance to allies. The report also provides estimates of the cost of each war as a share of Gross Domestic Product (GDP) during the peak year of each conflict and of overall defense spending as a share of GDP at the peak.
2 Comparisons of war Costs over a 230-year period, however, are inherently problematic. One problem is how to separate Costs of military operations from Costs of forces in peacetime. In recent years, the Department of Defense (DOD) has tried to identify the additional incremental expenses of engaging in military operations, over and above the Costs of maintaining standing military forces. Figures used in this report for the Costs of the Vietnam War and of the 1990-1991 Persian Gulf War are official DOD estimates of the incremental Costs of each conflict. Costs of post-9/11 military operations in Afghanistan, Iraq, and elsewhere are estimates of amounts appropriated to cover war-related expenses. These amounts appear to reflect a broader definition of war-related expenditures than earlier DOD estimates of incremental Vietnam or Persian Gulf War Costs . Before the Vietnam conflict, the Army and Navy, and later the DOD, did not identify incremental expenses of military operations.
3 For the War of 1812 through World War II, CRS estimated the Costs of conflicts by calculating the increase in expenditures of the Army and Navy compared to the average of the three years before each war. The premise is that increases reflect the cost of a temporary buildup to fight each war. Costs of the Revolutionary War and of the Confederate side in the Civil War are from other published sources. Costs of the Korean War were calculated by comparing DOD expenditures during the war with a trend line extending from the average of three years before the war to the average of three years after the war. Figures are problematic, as well, because of difficulties in comparing prices from one vastly different era to another. Inflation is one issue a dollar in the past would buy more than a dollar today. Perhaps a more significant problem is that wars appear vastly more expensive over time as the sophistication and cost of technology advances, both for military and for civilian purposes.
4 The estimates presented in this report , therefore, should be treated, not as truly comparable figures on a continuum, but as snapshots of vastly different periods of history. Costs of Major Wars congressional research Service Contents A Trillion Dollars for Wars Since 9/11 ..1 Varying Definitions of War Costs ..3 Sources of 4 Military Expenditures and GDP .. 4 Inflation Adjustments .. 5 Tables Table 1. Military Costs of Major Wars, 1 Contacts Author Contact Information .. 5 Costs of Major Wars congressional research Service 1 A Trillion Dollars for Wars Since 9/11 Since the terrorist attacks of September 11, 2001, Congress has appropriated more than a trillion dollars for military operations in Afghanistan, Iraq, and elsewhere around the world. The House and Senate are now considering an additional request for $33 billion in supplemental funding for the remainder of FY2010, and the Administration has also requested $159 billion to cover Costs of overseas operations in FY2011.
5 In the face of these substantial and growing sums, a recurring question has been how the mounting Costs of the nation s current wars compare to the Costs of earlier conflicts. The following table provides estimates of Costs of Major wars from the American Revolution through conflicts in Korea, Vietnam, and the Persian Gulf in 1990-1991. It also provides updated estimates of Costs of current operations. Estimates are in current year dollars that reflect values at the time of each conflict and in constant dollars that reflect today s prices. The table also shows estimates of war Costs as a share of the economy. Table 1. Military Costs of Major Wars, 1775-2010 (Updated to include appropriations enacted and requested through FY2010) Years of War Spending Peak Year of War Spending Total Military Cost of War in Millions/Billions of Dollars War Cost % GDP in Peak Year of War Total Defense % GDP in Peak Year of War American Revolution 1775-1783 Current Year $ 101 million NA NA Constant FY2011$ 2,407 million War of 1812 1812-1815 1813 Current Year $ 90 million Constant FY2011$ 1,553 million Mexican War 1846-1849 1847 Current Year $ 71 million Constant FY2011$ 2,376 million Civil War.
6 Union 1861-1865 1865 Current Year $ 3,183 million Constant FY2011$ 59,631 million Civil War: Confederacy 1861-1865 Current Year $ 1,000 million NA NA Constant FY2011$ 20,111 million Spanish American War 1898-1899 1899 Current Year $ 283 million Constant FY2011$ 9,034 million Costs of Major Wars congressional research Service 2 Years of War Spending Peak Year of War Spending Total Military Cost of War in Millions/Billions of Dollars War Cost % GDP in Peak Year of War Total Defense % GDP in Peak Year of War World War I 1917-1921 1919 Current Year $ 20 billion Constant FY2011$ 334 billion World War II 1941-1945 1945 Current Year $ 296 billion Constant FY2011$ 4.
7 104 billion Korea 1950-1953 1952 Current Year $ 30 billion Constant FY2011$ 341 billion Vietnam 1965-1975 1968 Current Year $ 111 billion Constant FY2011$ 738 billion Persian Gulf Warb 1990-1991 1991 Current Year $ 61 billion Constant FY2011$ 102 billion Iraqa 2003-2010 2008 Current Year $ 715 billion Constant FY2011$ 784 billion Afghanistan/Otherac 2001-2010 2010 Current Year $ 297 billion Constant FY2011$ 321 billion Total Post-9/11 Iraq, Afghanistan/Otherd 2001-2010 2008 Current Year $ 1,046 billion Constant FY2011$ 1.
8 147 billion Sources: All estimates are of the Costs of military operations only and do not reflect Costs of veterans benefits, interest on war-related debt, or assistance to allies. Except for Costs of the American Revolution and the Civil War Costs of the Confederacy, all estimates are based on government budget data. Current year dollar estimates of the Costs of the War of 1812 though World War II represent the increase in Army and Navy outlays during the period of each war compared to average military spending in the previous three years. For the Civil War Costs of the Confederacy, the estimate is from the Statistical Abstract of the United States, 1994. For the American Revolution, the estimate is from an unofficial financial history of the United States published in 1895. For the Korean War, the estimate represents increased expenditures of the DOD during the period of the conflict compared to the projected trend from the average of three years before the war to three years after.
9 For the Vietnam War and the Persian Gulf War, figures are DOD estimates of the incremental Costs of operations, meaning the Costs of war-related activities over and above the regular, non-wartime Costs of defense. For operations since September 11, 2001, through FY2009, figures reflect CRS estimates of amounts appropriated to cover war-related Costs . For FY2010, figures are DOD estimates of war-related appropriations. The current-year dollar estimates are converted to constant prices using estimates of changes in the consumer price index for years prior to 1940 and using Office of Management and Budget and DOD estimates of defense Costs of Major Wars congressional research Service 3 inflation for years thereafter. The CPI estimates used here are from a data base maintained at Oregon State University. The data base periodically updates figures for new official CPI estimates of the Department of Commerce.
10 A. Totals for post-9/11 operations include all funds appropriated through the enactment of FY2010 appropriations plus $33 billion in requested additional supplemental appropriations for FY2010. Totals are for activities of the DOD only and do not include Costs of reconstruction assistance, diplomatic security, and other activities by other agencies. Figures for post-9/11 Costs are for budget authority all other figures are for outlays. b. Most Persian Gulf War Costs were offset by allied contributions or were absorbed by DOD. Net Costs to taxpayers totaled $ billion in current year dollars. Source: Department of Defense Annual report to Congress for Fiscal Year 1994, January, 1993. c. Reflects funding for Operation Enduring Freedom, the bulk of which is for operations in Afghanistan but which also includes amounts for operations in the Philippines, the Horn of Africa, and other areas.