Transcription of CoT Chapter 2 2011 - Tshwane
1 6 Chapter 2 RESEARCH METHODOLOGY INTRODUCTION In order to establish the levels of satisfaction of primarily households and businesses regarding municipal service delivery, surveys were conducted in the jurisdiction areas of the City of Tshwane (CoT). One survey was conducted amongst households, a second was conducted amongst businesses and a third amongst embassies. This Chapter elaborates on the research methodology applied during the execution of the 2011 household, business and embassy surveys that largely resembles the methodology applied in 2009. The discussion will provide a basis for the scientific foundation of the study and hence the quality, validity and reliability of the data. The first part of the Chapter focuses on the research methodology used for the household satisfaction survey.
2 This is followed by a discussion of the business survey research methodology. Finally, the Chapter focuses on the research methodology used to survey the foreign embassies. HOUSEHOLD SURVEY RESEARCH METHODOLOGY The research methodology applied to collect primary data from households residing in the CoT is explained below. Survey population The survey population is defined below in terms of sample units, sample elements and the geographical demarcation of the survey area. Sample units The sample population of the survey comprised all households residing in the CoT. For purposes of selecting sample units for interviewing, the following dwelling types (sample units) were eligible for inclusion: 7 Formal dwellings such as houses, flats/apartments, townhouses/cluster houses and rooms (division within a dwelling occupied by a separate household).
3 Informal dwellings/shacks on own stand, backyard informal dwellings/shacks and outbuildings/cottages. Households occupying any of the above types of dwellings are defined as a person or a group of persons, who occupy a common dwelling (or part of it) and who provide themselves with food and other necessities of life. In other words they live together as a unit. People occupying the same dwelling, but not sharing food and other necessities, are regarded as separate households. Sample elements Heads of households were identified as the sample elements for the survey. To qualify for selection as a respondent a resident should have resided at the household address for at least six months. Heads of households that were not available/willing for interviewing were substituted with his/her spouse.
4 Survey areas The survey area comprised the following five regions of the CoT: Central Western Region North Western Region North Eastern Region Eastern Region Southern Region 8 These regions were subdivided into 76 municipal wards. Each ward was further subdivided into the following four types of areas by dwelling type: formal township area inner city suburbs informal settlement area The wards and the above strata were used for sample stratification purposes. Table depicts the five CoT regions by ward and the major suburbs initially included in each region. TABLE REGIONS AND SETTLEMENT TYPE OF THE CITY OF Tshwane BY REGION AND WARD Central Western Region Ward Suburbs 1 Capital Park, Daspoort, Hermanstad, Mountain View, Park Town Estate, Pretoria Gardens, Roseville 3 Philip Nel Park, Pretoria, Proclamation Hill, West Park 7 Lotus Gardens 51 Atteridgeville (25 29) 55 Andeon, Booysens, Claremont, Kirkney, Elandspoort, Suiderberg, Lady Selborne, Danville 56 Brooklyn, Lynnwood, Colbyn, Hatfield, Hillcrest 58 Arcadia, Sunnyside, Riviera 59 Groenkloof, Lukasrand, Muckleneuk, Nieu Muckleneuk, Hatfield, Sterrewag60 Pretoria Industrial, Kwaggasrand, Westpark 62 Atteridgeville 63 Atteridgeville (3,6) 68 Atteridgeville (7,17) 71 Atteridgeville (16,18)
5 , Blair Athol 72 Saulsville 9 North Western Region Ward Suburb 2 Dorandia, Florauna, Ninapark, Pretoria North, Theresapark, Tileba 4 Amandasig, Chantelle, Clarina, Karenpark, Rosslyn, The Orchards, Heatherview9 Winterveld 11 Soshanguve (FF, GG, HH, JJ, LL) 12 Soshanguve (AA, BB, EE) 19 Mabopane (A,E,N,S) 20 Kopanong 21 Mabopane (a,b,x) 22 Mabopane (R,T,U,V) (Nooitgedacht Dam) 24 Winterveld AH 25 Soshanguve (PP,T,V,W) 26 Soshanguve (DD,KK,P,PP,R,S,SS) 27 Soshanguve (CC,P,R,S,W,X,Y) 29 Soshanguve (BB,FF,IA,LL,NN) 30 Ga rankuwa Unit 4,15,16,17,23,24,25) 31 Ga rankuwa Unit 1,2,5 32 Ga rankuwa Unit (3,6 10,13,21,22) 33 Soshanguve (AA,F,G) 34 Soshanguve (H,L) 35 Soshanguve (K,M,UU) 36 Soshanguve (K,L,M,WW,YY,ZZ) 37 Soshanguve South (1,2,3) 39 Soshanguve South (4,5,14), Soshanguve East North Eastern Region Ward Suburb 5 Doornpoort, Montana, Montana Park, Montana Tuine 8 Dilopye (Temba), Suurman 13 New Eersterust 14 Stinkwater, Tswaing Village, Zoutpan 49 Onderstepoort AH, Wolmer, Mont Lorraine AH, Bon Accord AH, Pyramid / Pyramid Estate AH 50 Annlin, Annlin wes, Magalieskruin, Sinoville, Wonderboom AH 73 Hammanskraal (1,2), Marokolong, Ramotse, Mandela Village 74 Hammanskraal West 75 Babelegi, Kudube Unit 1,2,3,6,7,10,11,d 76 Majaneng, Mashemong 10 Eastern Region Ward Suburbs 6 Mamelodi (15) (east) 10 Mamelodi (8,11,12,20,22) 15 Mamelodi (4,5) 16 Mamelodi (6)
6 17 Mahube Valley, Mamelodi (7,10) 18 Mamelodi (1,2,3) 23 Mamelodi (14) (Moretele View) (South) 28 Mamelodi (26) (South) 38 Mamelodi (24) (West) 40 Die Wilgers, Equestria, La Montagne, Nellmapius, Samcor Park, Willow Park Manor, Meyerspark 41 Brummeria, Silverton, Weavind Park, Persequor, Koedoespoort 42 Ashlea Gardens, Elardus park, Erasmusrand, Menlo Park, Newlands, Waterkloof, Waterkloof Heights, Menlyn, Waterkloof Glen 43 East Lynne, Jan Niemand Park, Eersterust, Silvertondale, Waltloo 44 Faerie Glen, Garsfontein, Wapadrand 45 Constantia Park, Erasmuskloof, Moreletapark, Pretoriuspark 46 Die Wilgers, Lynnwood Glen, Lynnwood Manor, Lynnwood Ridge Murrayfield, Val de grace 47 Elardus Park, Erasmuskloof, Irene, Rietvalleirand, Wingate Park 52 East Lynne, Kilner Park, Lindo Park, Waverley, Moregloed 53 Queenswood, Rietondale, Riviera, Kilnerpark.
7 Rietfontein 54 Eloffsdal, Les Marais, Mayville, Rietfontein, Villieria, Wonderboom South, Gezina 67 Mamelodi (13) (North) Southern Region Ward Suburbs 48 Celtisdal, Kosmosdal, Monavoni, Olievenhoutbos, Peach Tree 57 Lyttelton Manor, Monument Park, Doringkloof 61 Claudius, Erasmia, Laudium 64 Highveld, Irene, Louwlardia, Rooihuiskraal, The Reeds 65 Pierre van Ryneveld, Cornwall Hill 66 Glen Lauriston, Valhalla 69 Clubview, Hennopspark, Zwartkop, Centurion 70 Eldoraigne, Rooihuiskraal Noord, Sunderland Ridge, Wierda Park Household sample plan design The sample plan design for the household survey is explained below in terms of the sampling methodology, sample size and sample selection procedure. Sampling methodology In an attempt to facilitate the analysis on a ward level, a sample plan was designed to meet this endeavour.
8 This required a multistage sampling approach by firstly listing the size of the population according to the five CoT regions. This allowed for a representative sample approach whereby the sample sizes were allotted to each region in proportion to population numbers. The regional population data, as supplied by the CoT was used to construct the sample plan. Once the regional sample sizes were proportionately distributed to the total sample of 3 000, the population ward information provided by the CoT, was used to further distribute the sample among the wards within each region. For this purpose, a judgemental sampling procedure, guided by population numbers and the geographic distribution of the ward population, was applied.
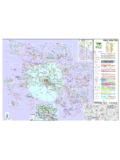
9 Geographic ward maps, as supplied by the CoT, were used in awarding final sample sizes for the selected wards. Within each region the following variables were also taken into account when allocating the final sample sizes to the four identified dwelling types (formal township, informal settlement, suburb and inner city): (a) Dwelling typology to distinguish between formal and informal dwellings. (b) Landline telephone ownership to facilitate the application of both telephone and face to face interviews. Telephone interviews were conducted in suburbs and the inner city, and face to face interviews in township areas and informal settlements. (c) Sample representivity, implying that a minimum of 30 questionnaires were completed in each ward per region to support statistical analyses.
10 12 Finally, in order to judge the representation of the sample sizes by region and settlement type according to the above criteria, the 2001 adjusted census figures of Stats SA were used. Sample size Table reflects the sample size of 3 000 questionnaires by region. The sample size per region varies between 960 for the North Western Region to 290 in the Southern Region. Table also reflects the distribution of the sample surveyed by telephone and personal face to face interviews. TABLE SAMPLE SIZE BY WARD AND ADMINISTRATIVE REGION Region Number of wards Sample size Face to face Telephone Total Central Western Region 14 205 320 525 North Western Region 23 890 70 960 North Eastern Region 10 315115430 Southern Region 8 0 290 290 Eastern Region 21 390 405 795 Total 76 1 800 1 200 3 000 It is clear from table that the final sample consisted of 1 200 telephone and 1 800 personal face to face interviews.