Transcription of Counseling Asian American Adults with Speech, Language ...
1 Counseling Asian American Adults With Speech, Language , and Swallowing Disorders James Y. Kuo Xiaolu Hu San Jose State University, CA. T he United States is a country with an extremely rich cultural diversity. According to Graeco and Cassidy (2001), the United States consists of of Caucasians, followed by African Americans ( ), Asian Americans ( ), American Indians Asian Americans will increase from 15 million in 2010 to 34 million in 2050, when they will constitute of the total population of the United States. The increase of Asian Americans during the past two decades greatly impacts the field of speech- Language ( ), Pacific Islanders ( ), some other race ( ), pathology.
2 Today, speech- Language pathologists are much and two or more ra es ( ). The population of Asian more likely than 20 years ago to encounter Asian individu- Americans has increased significantly during the past two als with speech, Language , or swallowing deficits in their decades (Graeco & Cassidy, 2001; Bureau of the work settings. Because of the differences in Language and Census, 1993). It increased from million in 1980 to cultural backgrounds, the diagnostic and therapeutic million in 2000 an average increase of million techniques used with this ethnic group, as well as the each decade.
3 Day (1996) estimated that the number of Counseling strategies, may differ from those used with other ethnic populations. The American Speech- Language -Hearing Association (ASHA) has recognized the importance of this ABSTRACT: The population of Asian Americans has issue by establishing a special division, which emphasizes increased dramatically during the past two decades. the need to provide and appropriately accommodate Today, speech- Language pathologists are much more likely than 20 years ago to encounter Asian Adults with diagnostic and treatment services to individuals from speech, Language , or swallowing deficits.
4 Due to the diverse cultural backgrounds and adjust treatment and limited number of Asian speech- Language pathologists in assessment services accordingly (2001b). this country, treatment is usually provided by non- Asian It is very encouraging to see that 53 tests have been speech- Language pathologists. Therefore, all speech- designed for various Asian groups for the purpose of speech Language pathologists should know the characteristics of and Language assessment. ASHA (2001a) listed information Asian individuals. The purpose of this article is to regarding these 53 tests in detail.
5 The validity and reliability discuss the prevalence of speech, Language , and swallow- of some of these tests are questionable, and further research ing disorders among Asian American Adults and show is needed in order to explore this area. On the other hand, how speech- Language pathologists can collaborate with no information in the area of Counseling Asian individuals Asian communities and better understand the Asian culture in order to facilitate the process of Counseling with speech, Language , and/or swallowing deficits is cur- during interventions.
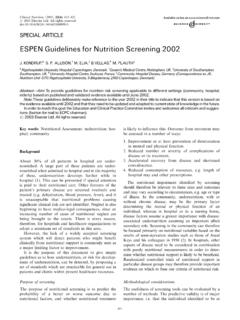
6 Rently available. The purpose of this article is to describe characteristics of Asian populations living in the United KEY WORDS: Asian , Asian American , Asian cultural States and to address how culture and culture values need to values, Counseling be considered in the Counseling process for individuals with speech, Language , and swallowing disorders. CONTEMPORARY ISSUES IN COMMUNICATION SCIENCE AND DISORDERS Volume 29 35 42 Spring 2002 NSSLHA 35. 1092-5171/02/2901-0035. Table 2. Distribution of Asian Americans (in thousands) by Asian POPULATIONS IN THE state and the percentage of Asian Americans within each state for census year 2000 ( Bureau of the Census, 2001).
7 UNITED STATES. Current Asian American Population State Asian population Percentage A total of million Asian Americans are currently living in the United States (Graeco & Cassidy, 2001). Table 1 California 3,692 shows the Asian American population categorized by ethnic New York 1,043 group in the 1990 census ( Bureau of the Census, Texas 563 Hawaii 504 1993). The same type of data by ethnic group for Census New Jersey 480 2000 is not yet available. According to the Census Bureau Illinois 422 (1993), Chinese Americans are the largest Asian group, Washington 324 consisting of of all Asian Americans.
8 This is Florida 272 followed by Filipinos ( ), Japanese ( ), Asian Virginia 262 Massachusetts 241 Indians ( ), Koreans ( ), and Vietnamese ( ). Pennsylvania 221 Ten other Asian groups include Laotian, Cambodian, Thai, Maryland 212 Hmong, Pakistani, Indonesian, Malayan, Bangladeshi, Sri Michigan 179 Lankan, and Burmese. Each of these Asian groups makes Georgia 172 Minnesota 143 up 2% or less of the Asian American population. It is Ohio 136 important to emphasize that the Census Bureau (1993) North Carolina 113 indicated that all Asian groups, regardless of size, are Oregon 103 important and make continuing contributions to the Colorado 95 diversity of the United States.
9 Arizona 92 Wisconsin 91 Table 2 lists the numbers of Asians living in the various Nevada 90 states for census year 2000 ( Bureau of the Census, Connecticut 82 2001). Sixty-six percent of Asian Americans live in six Missouri 62 states California, New York, Texas, Hawaii, New Jersey, Indiana 61 Tennessee 57 and Illinois. Almost half (46%) of the Asian Americans Louisiana 54 reside in the Pacific Coast Region, consisting of California, Oklahoma 48 Oregon, Washington, Hawaii, and Alaska. Kansas 46 A great majority of the Asian Americans (an average of Iowa 38 66%) is foreign born, as shown in Table 1 ( Bureau of Utah 38 South Carolina 36 the Census, 1993).
10 These Asian Americans were exposed to Alabama 31 one or several Asian cultures and languages for a period of Kentucky 28 time before they immigrated to the United States. Conse- Alaska 25 quently, their English proficiency is highly variable. Battle Rhode Island 24 Nebraska 22 Arkansas 21 Table 1. Distribution of Asian population (in thousands) in the New Mexico 20 United States by Asian ethnic group for census year 1990 Mississippi 20 ( Bureau of the Census, 1993). Delaware 16 New Hampshire 16 District of Columbia 15 Idaho 12 Population % of Asian % of West Virginia 9 Ethnic group (in thousand) population foreign born Maine 9 Vermont 5 South Dakota 5 Chinese 1,645 Montana 5 Filipino 1,407 North Dakota 4 Japanese 848 Wyoming 3 Asian Indian 815 Korean 799 Vietnamese 615 Laotian 152 Cambodian 145 (1998) reported that the percentage of Asian Americans Thai 90 who speak English less than very well increases with Hmong 90 Pakistani 83 age.