Transcription of Counterpoint Global Insights Underestimating the Red Queen
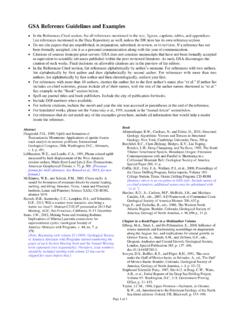
1 Counterpoint Global Insights Underestimating the Red Queen Measuring Growth and Maintenance Investments CONSILIENT OBSERVER | January 27, 2022 Introduction Geoffrey West is a theoretical physicist who may be best known for his work in biological systems. A distinguished professor and past president of the Santa Fe Institute, West and his collaborators explained previously unexplained empirical The most famous of these is the eponymous law developed by a biologist named Max In exhibit 1, which depicts the law, the x-axis is an animal s body mass, measured on a logarithmic scale. (Instead of 1, 2, 3, the scale is 1, 10, 100 so that the percentage difference between the points is the same.) The y-axis, also on a logarithmic scale, measures the animal s metabolic rate, or energy used per unit of time.
2 Kleiber s law is the observation that the outcome of the plot is a straight line with a slope, or rise over run, of three-fourths ( ). This is a classic example of a power law. As West explains, the slope of the graph is just the exponent of the power law. 3 Simply stated, West and his research partners used math to show that the relationship is the result of how energy is dissipated through a Evolution figured out the optimal network structure to feed all of the cells in the body, which applies to a mouse as it does to an elephant. Nature is amazing. The principles behind these networks explain other features of the systems, including the rate of blood flow, the number of heartbeats, longevity, and growth. Some of these scaling laws apply to social systems as well, including cities and Our focus is on growth.
3 We are all familiar with physical growth, as we ourselves grew and we watch the growth of others. But have you ever wondered why you stopped growing? Indeed, other living things, including certain trees, fish, and plants, grow until they die. Since you continue to provide your body with energy through nourishment, why did you reach a point of maturity and stop growing taller? AUTHORS Michael J. Mauboussin Dan Callahan, CFA 2022 Morgan Stanley. All rights reserved. 4211216 Exp. 1/31/2023 2 Exhibit 1: Kleiber s Law Source: Based on Supplementary Material 1: Basal Metabolic Rate, Body Mass & Temperature in Mammals, Data set for Andrew Clarke, Peter Rothery, and Nick J. B. Isaac, Scaling of basal metabolic rate with body mass and temperature in mammals, Journal of Animal Ecology, Vol.
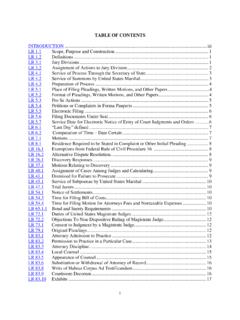
4 79, No. 3, May 2010, 610-619. West explains that energy is allocated between the growth of new cells and the maintenance and repair of existing ones. When you are born, your energy can largely be directed toward growth. But after you reach a certain size, all of your energy has to go to maintenance and repair and you stop Scientists have developed equations that predict the relationship between age and size. It turns out the growth curves are the same for all animals when you replace specific units of time and mass with dimensionless units (see exhibit 2).7 Exhibit 2: Universal Growth Curve Source: Geoffrey West. VoleMouseBatChipmunkPrairie Metabolic Rate (Watts)Log Body Mass (Kilograms) 2022 Morgan Stanley. All rights reserved. 4211216 Exp. 1/31/2023 3 In this report, we suggest that a similar framework is relevant for understanding corporate growth.
5 Indeed, West and another group of colleagues have derived a universal growth curve for Instead of energy, the input is financial capital. But the allocation between growth and maintenance is the same. This topic is important because you can anticipate a company s growth only if you understand how much capital the company spends on growth versus maintenance. A company s prospects for growth may be dimmer than you believe if it is spending more on maintenance than you think. In lewis Carroll s novel, Through the Looking-Glass, the Red Queen says, Now, here, you see, it takes all the running you can do, to keep in the same place. If you want to get somewhere else, you must run at least twice as fast as that! 9 Estimating maintenance capital expenditures provides insight into how fast a company has to run just to stay in place.
6 The distinction between growth and maintenance spending is complicated by the role of inflation and technological obsolescence. When prices are rising, capital expenditures will exceed depreciation even when the business is stable because new capital expenditures reflect inflation while depreciation is based on historical costs. In the case of falling prices, or deflation, capital expenditures get cheaper over time and depreciation can overstate maintenance costs. Think of products that have benefitted from Moore s Law, which suggests the cost of computing declines over time. Sometimes first movers have to spend more than followers Technological obsolescence creates the risk that a company overestimates an asset s useful life. For example, the costs for companies in certain industries addressing climate change, or for automobile manufacturers migrating from internal combustion engines to electric vehicles, are potentially massive.
7 These costs are necessary to maintain market position, sales, and competitiveness. In the cases of inflation or obsolescence, less investment will go toward growth and more will be required to maintain current operations. Investment spending for growth is not limited to tangible assets but also includes non-physical intangible assets. Today, total intangible investments exceed tangible ones and accounting for them is very challenging. For example, a young company s sales and marketing budget is often dedicated primarily to acquiring new customers, but as the business matures that expense is split between growth spending to acquire new customers and maintenance spending to retain customers. The data suggest two stories of growth. For tangible assets, depreciation tends to understate maintenance capital expenditures.
8 The tangible part of the economy is on average mature, with capital expenditures as a percentage of sales flat to down for the last three decades. This is important because recent research shows that firms that underestimate their maintenance investments experience future write-offs and negative future earnings and are associated with significantly negative future abnormal stock returns. 11 The intangible part of the economy appears to be younger. Intangible selling, general, and administrative (SG&A) investments as a percentage of sales have risen steadily over the last three decades, with some acceleration in growth since the turn of the century (see exhibit 3). This is relevant because firms with high intangibles grow faster, on average, than firms with low intangibles but also have a higher standard deviation of Academics studying this issue found that buying firms with high intangibles and shorting those with low intangibles generated an average annual return of percentage points from June 1989 to November 2022 Morgan Stanley.
9 All rights reserved. 4211216 Exp. 1/31/2023 4 Exhibit 3: Intangible SG&A Investments and Capital Expenditures, 1990-2020 Source: Intangible SG&A investments is based on Luminita Enache and Anup Srivastava, Should Intangible Investments Be Reported Separately or Commingled with Operating Expenses? New Evidence, Management Science, Vol. 64, No. 7, July 2018, 3446-3468. Data extended through 2018 by Anup Srivastava. Includes Counterpoint Global estimates. FactSet. Note: Intangible SG&A investments and capital expenditures reflect the Russell 3000 excluding the financial and real estate sectors; Intangible investments=R&D + Advertising + Investment Main SG&A. Accounting for Growth Let s start with a simple case before we introduce Assume a company needs four machines with a useful life of four years each to run its operations.
10 The sales for the company are in a steady state, the ages of the machines are staggered (new, one-year old, etc.), the machines have no salvage value, and the company uses straight-line depreciation. At the end of each year, the company spends $80,000 to replace the machine at the end of its life and there is no inflation. Capital expenditures and the depreciation for each year are $80,000. Free cash flow, the number we project and discount in a discounted-cash flow model, is typically defined as net operating profit after taxes (NOPAT) minus investment in future growth (I). Investment in future growth captures changes in net working capital, as companies often need to increase their working capital as they grow, and capital expenditures net of depreciation. The simplifying assumption is that depreciation is a reasonable proxy for maintenance capital spending and that investment in excess of depreciation is allocated to growth.