Transcription of Country classification - United Nations
1 Country classification Data sources, Country classifications and aggregation methodology The statistical annex contains a set of data that the World Economic Situation and Prospects (WESP) employs to delineate trends in various dimensions of the world economy. Data sources The annex was prepared by the Development Policy and Analysis Division (DPAD) of the Department of Economic and Social Affairs of the United Nations Secretariat (UN/DESA). It is based on information obtained from the Statistics Division and the Population Division of UN/DESA, as well as from the five United Nations regional commissions, the United Na- tions Conference on Trade and Development (UNCTAD), the United Nations World Tour- ism Organization (UNWTO), the International Monetary Fund (IMF), the World Bank, the Organization for Economic Cooperation and Development (OECD), and national and private sources.
2 Estimates for the most recent years were made by DPAD in consultation with the regional commissions, UNCTAD, UNWTO and participants in Project LINK, an international collaborative research group for econometric modelling coordinated jointly by DPAD and the University of Toronto. Forecasts for 2014 and 2015 are primarily based on the World Economic Forecasting Model of DPAD, with support from Project LINK. Data presented in WESP may differ from those published by other organizations for a series of reasons, including differences in timing, sample composition and aggregation methods.
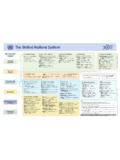
3 Historical data may differ from those in previous editions of WESP because of updating and changes in the availability of data for individual countries. Country classifications For analytical purposes, WESP classifies all countries of the world into one of three broad categories: developed economies, economies in transition and developing economies. The composition of these groupings, specified in tables A, B and C, is intended to reflect basic economic Country conditions. Several countries (in particular the economies in transition). have characteristics that could place them in more than one category; however, for purposes of analysis, the groupings have been made mutually exclusive.
4 Within each broad category, some subgroups are defined based either on geographical location or on ad hoc criteria, such as the subgroup of major developed economies , which is based on the membership of the Group of Seven. Geographical regions for developing economies are as follows: Africa, East Asia, South Asia, Western Asia, and Latin America and the 1 Names and composition of geographical areas follow those specified in the statistical paper entitled Standard Country or area codes for statistical use (ST/ESA/ 4). 144 World Economic Situation and Prospects 2014.
5 In parts of the analysis, a distinction is made between fuel exporters and fuel importers from among the economies in transition and the developing countries. An economy is classified as a fuel exporter if the share of fuel exports in its total merchandise exports is greater than 20 per cent and the level of fuel exports is at least 20 per cent higher than that of the Country 's fuel imports. This criterion is drawn from the share of fuel exports in the total value of world merchandise trade. Fuels include coal, oil and natural gas (table D). For other parts of the analysis, countries have been classified by their level of devel- opment as measured by per capita gross national income (GNI).
6 Accordingly, countries have been grouped as high-income, upper middle income, lower middle income and low-income (table E). To maintain compatibility with similar classifications used else- where, the threshold levels of GNI per capita are those established by the World Bank. Countries with less than $1,035 GNI per capita are classified as low-income countries, those with between $1,036 and $4,085 as lower middle income countries, those with between $4,086 and $12,615 as upper middle income countries, and those with incomes of more than $12,615 as high-income countries.
7 GNI per capita in dollar terms is esti- mated using the World Bank Atlas method, 2 and the classification in table E is based on data for 2012. The list of the least developed countries (LDCs) is decided upon by the United Nations Economic and Social Council and, ultimately, by the General Assembly, on the basis of recommendations made by the Committee for Development Policy. The basic criteria for inclusion require that certain thresholds be met with regard to per capita GNI, a human assets index and an economic vulnerability As at 29 November 2013, there were 49 LDCs (table F).
8 WESP also makes reference to the group of heavily indebted poor countries (HIPCs), which are considered by the World Bank and IMF as part of their debt-relief initiative (the Enhanced HIPC Initiative).4 In September 2013, there were 39 HIPCs (see table G). Aggregation methodology Aggregate data are either sums or weighted averages of individual Country data. Unless otherwise indicated, multi-year averages of growth rates are expressed as compound an- nual percentage rates of change. The convention followed is to omit the base year in a multi-year growth rate.
9 For example, the 10-year average growth rate for the decade of the 2000s would be identified as the average annual growth rate for the period from 2001. to 2010. WESP utilizes exchange-rate conversions of national data in order to aggregate output of individual countries into regional and global totals. The growth of output in each group of countries is calculated from the sum of gross domestic product (GDP). of individual countries measured at 2005 prices and exchange rates. Data for GDP in 2 See 3 Handbook on the Least Developed Country Category: Inclusion, Graduation and Special Support Measures ( United Nations publication, Sales No.)
10 Available from devplan/ 4 IMF, Debt Relief Under the Heavily Indebted Poor Countries (HIPC) Initiative Available from Country classification 145. 2005 in national currencies were converted into dollars (with selected adjustments) and extended forwards and backwards in time using changes in real GDP for each Country . This method supplies a reasonable set of aggregate growth rates for a period of about 15. years, centred on 2005. The exchange-rate based method differs from the one mainly applied by the IMF. and the World Bank for their estimates of world and regional economic growth, which is based on purchasing power parity (PPP) weights.