Transcription of COVID-19 Monitor - vaccines, cases, variants
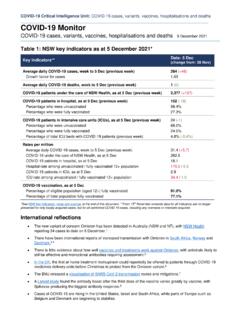
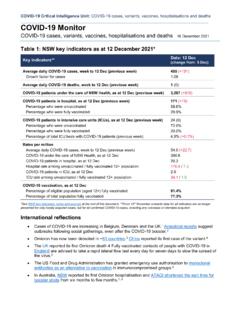
1 COVID-19 Critical Intelligence Unit: COVID-19 cases, variants , vaccines, hospitalisations and deaths COVID-19 Monitor COVID-19 cases, variants , vaccines, hospitalisations and deaths 18 November 2021. Table 1: NSW key indicators as at 14 November 2021*. Date: 14 Nov Key indicators**. (change from: 7 Nov). Average daily COVID-19 cases, week to 14 Nov (previous week) 228 (+1). Growth factor for cases Average daily COVID-19 deaths, week to 14 Nov (previous week) 1 (-2). COVID-19 patients under the care of NSW Health, as at 14 Nov (previous week) 2,666 (-102). COVID-19 patients in hospital, as at 14 Nov (previous week) 216 (-47). Percentage who were unvaccinated Percentage who were fully vaccinated COVID-19 patients in intensive care units (ICUs), as at 14 Nov (previous week) 32 (-15).
2 Percentage who were unvaccinated Percentage who were fully vaccinated Percentage of total ICU beds with COVID-19 patients (previous week) ( ). Rates per million Average daily COVID-19 cases, week to 14 Nov (previous week) (+ ). COVID-19 under the care of NSW Health, as at 14 Nov COVID-19 patients in hospital, as at 14 Nov Hospital rate among unvaccinated / fully vaccinated 12+ population / COVID-19 patients in ICU, as at 14 Nov ICU rate among unvaccinated / fully vaccinated 12+ population / COVID-19 vaccination, as at 14 Nov Percentage of eligible population (aged 12+) fully vaccinated Percentage of total population fully vaccinated *See NSW key indicators: notes and sources at the end of this document. **From 15th November onwards data for all indicators are no longer presented for only locally acquired cases, but for all confirmed COVID-19 cases, including any overseas or interstate acquired.
3 International reflections Increases in case numbers continue in Canada, most US states, and many European countries (but decline in the UK).1-4. Partial or targeted lockdowns have been re-introduced in Austria and the In Canada, children under 12 are contracting COVID-19 more than all other age groups. Israel has approved vaccination for children 5 to 11 years of , 6. The number of active COVID-19 cases decreased in NSW but increased in all other 1. COVID-19 Critical Intelligence Unit: COVID-19 cases, variants , vaccines, hospitalisations and deaths Table 2: Summary of public health, healthcare and vaccination measures (select countries, Canadian provinces and NSW) as at 15 November 2021*. 7-day 7-day 7-day % total COVID-19 COVID-19 COVID-19 COVID-19 .
4 Average average average population patients in patients in patients in patients in confirmed confirmed deaths fully hospital hospital ICU ICU (per cases cases (per (per vaccinated (per million). million) million) million). NSW 228 216 32 Australia 1,250 615 110 Belgium 10,521 1,948 391 Canada 2,498 1,613 495 Ontario 563 301 139 Quebec 639 202 42 Denmark 3,228 282 40 Israel 431 193 109 Japan 169 1,715 82 Portugal 1,477 341 64 Singapore 2,638 1,533 123 United 38,564 8,652 999 Kingdom United 83,493 41,258 11,274 States *Please see Summary of public health: notes and sources at the end of this document. 2. COVID-19 Critical Intelligence Unit: COVID-19 cases, variants , vaccines, hospitalisations and deaths COVID-19 confirmed cases Figure 1 shows the daily rate per million population (rolling seven-day average) of confirmed COVID-19 .
5 Cases in NSW, Australia, United Kingdom, United States, Canada, Israel, Portugal and Denmark, from March 2020 to November 2021. Figure 1: daily rates of COVID-19 cases (select countries and NSW), March 2020 November 2021. Note: Limited testing and delayed reporting likely result in underestimation of the actual number of confirmed cases. Source: Data for the selected countries sourced from Our World in Data for NSW sourced from NSW. Health via Notifiable Conditions Information Management Both accessed 16 November 2021. 3. COVID-19 Critical Intelligence Unit: COVID-19 cases, variants , vaccines, hospitalisations and deaths COVID-19 mortality rates Figure 2 shows the daily (rolling seven-day average) mortality rate per million population in NSW, Australia, United Kingdom, United States, Canada, Israel, Portugal and Denmark, from May to November 2021.
6 Figure 2: daily mortality rates (select countries and NSW), May November 2021. Note: Limited testing and challenges in the attribution of the cause of death means that the number of confirmed deaths may not be an accurate count of the true number of deaths from COVID-19 . Source: Data for the selected countries sourced from Our World in Data for NSW sourced from NSW. Health via the Notifiable Conditions Information Management Both accessed 16 November 2021. 4. COVID-19 Critical Intelligence Unit: COVID-19 cases, variants , vaccines, hospitalisations and deaths COVID-19 cases, testing, variants , vaccines, hospitalisations and deaths*. The following graphs (figures 3-8) show COVID-19 cases and vaccination rates; hospitalisation and death rates; and the variant distribution for NSW, Australia, United Kingdom, United States, Canada and Israel.
7 Series a: COVID-19 cases and vaccinations The graphs in series a' show COVID-19 cases and vaccination rates for NSW and each of these countries from March 2020 to November 2021. They include: the daily rate per million population (rolling seven-day average) of confirmed COVID-19 cases the cumulative number of people who have received at least one vaccine dose (per 100 population). the cumulative number of people fully vaccinated (per 100 population). These graphs should be interpreted with caution as there are other factors that may influence the number of cases in addition to vaccination rates, including the level of social restrictions. The cumulative number of people vaccinated per hundred population (at least one dose or fully vaccinated) is based on the full population (all ages) for all locations and countries, including NSW, to enable accurate comparability.
8 The number of people fully vaccinated in Australia is only available from late May 2021 onwards. Note, there is variation in both x' axis and y' axis scales and some gaps in time series across these graphs due to missing data. Series b: COVID-19 hospitalisation and death rates The graphs in series b' show COVID-19 hospitalisation and death rates for NSW and each of these countries. Specifically, they show the daily number of hospitalised patients (per million population) and the daily number of new deaths (rolling seven-day average and per million population), from March 2020 to November 2021. Note, there is variation in both x' axis and y' axis scales and some gaps in time series across these graphs due to missing data.
9 Series c: COVID-19 variant distribution The stacked area graphs in series c' show the COVID-19 variant distribution for each of these countries. Specifically, they show COVID-19 variant distribution for cases sequenced, and the percentage of total COVID-19 cases sequenced, from May 2021 to November 2021. For most countries, weekly counts are shown; however, only monthly counts were available for Canada. No information on variants is available for NSW. Note, there is variation in both x' axis and y' axis scales and some gaps in time series across these graphs due to missing data. *Please see further COVID-19 cases: notes and sources at the end of this document. 5. COVID-19 Critical Intelligence Unit: COVID-19 cases, variants , vaccines, hospitalisations and deaths NSW.
10 Figure 3a: COVID-19 cases and vaccinations, NSW, March 2020 November 2021. Figure 3b: COVID-19 hospitalisation and mortality rates, NSW, March 2020 November 2021. 6. COVID-19 Critical Intelligence Unit: COVID-19 cases, variants , vaccines, hospitalisations and deaths Australia Figure 4a: COVID-19 cases and vaccinations, Australia, March 2020 November 2021. Figure 4b: COVID-19 hospitalisation and mortality rates, Australia, March 2020 November 2021. Figure 4c: COVID-19 variant distribution for sample of cases that have been sequenced, Australia, May November 2021. 7. COVID-19 Critical Intelligence Unit: COVID-19 cases, variants , vaccines, hospitalisations and deaths United Kingdom Figure 5a: COVID-19 cases and vaccinations, United Kingdom, March 2020 November 2021.
