Transcription of COVID-19 Trend Analysis using Machine Learning Techniques
1 COVID-19 Trend Analysis using Machine Learning Techniques Abstract With COVID-19 being the highlight of the decade and information related to it on the rise in an unorganized manner, the need for a centralized platform to gather information from on an international front doesn t seem to be far fetched. The data dashboard is formed with help of data taken from reliable sources to portrait it in an interactive and easy to consume format with salient features like a chatbot, cases prediction with help of Machine Learning and projection, of data in numerous formats updated daily. The paper aims to provide a better understanding to neophytes regarding the current Trend of coronavirus in the world along with imparting basic knowledge about the deadly virus.
2 Keywords COVID-19 , Machine Learning , Prediction, Data Dashboard 1. INTRODUCTION This project is one of the coronavirus related theme projects. It is a Machine Learning based website for a data dashboard. A data dashboard is an information management tool that visually tracks, analyses and displays key performance indicators (KPI), metrics and key data points to monitor the specific process. The dashboard consists of two fronts: front and back. The back end consists of data gathering, data preparation, data Analysis , chat bot and Machine Learning , all of which is implemented using Python. The front end consists of making the website, converting the processed information at backend to a consumable form, and deploying all these features online.
3 At the back-end data for prediction and showcasing data for different purposes was gathered from the official repository of John Hopkins University. For chatbot the data was taken from to fetch questions, and answer to faqs. At the front-end the files were processed into consumable material for website building purposes using python based open-source framework Django. The website was made presentable and interactive using CSS and HTML. All these features combined formed a live data dashboard as a website updating itself daily, showing total number of cases for each country separately and in form of a world map for better relative understanding of the situation.
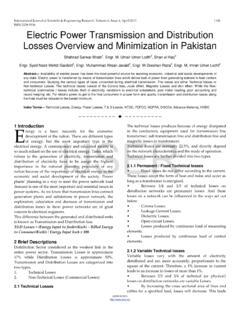
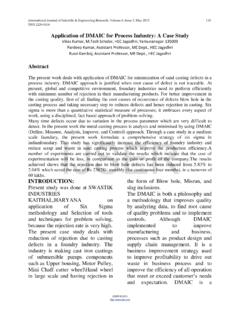
4 It also portraits the recovering and infected cases for each countries in a graphical form for detailed view. The dashboard gives you an option to put in your queries and get the answers to them in form of a chatbot along with giving prediction of total number of cases for each country in near future. The website also offers you a feature to download the data in four different form (png, svg vector image and pdf, jpeg ). Basic architecture of the COVID-19 data dashboard is shown in Fig 1. and MVC (Model View Controller) architecture for desired visual effects on the dashboard is shown in Fig 2. Fig 1. Data Dashboard Architecture 1 Abhishek Jaglan Student - CSE Dr.
5 Akhilesh Das Gupta Institute of Technology and Management New Delhi, India Daksh Trehan Student - CSE Dr. Akhilesh Das Gupta Institute of Technology and Management New Delhi, India Ms Megha Assistant Professor - CSE Dr. Akhilesh Das Gupta Institute of Technology and Management Priyansh Singhal Student - CSE Dr. Akhilesh Das Gupta Institute of Technology and Management New Delhi, India International Journal of Scientific & Engineering Research Volume 11, Issue 12, December-2020 ISSN 2229-5518 1162 IJSER 2020 Fig 2. MVC Architecture 2. PREDICTION Data Procurement and Preparation The dataset that has been utilized in prediction is fetched from data archive for 2019 Novel CoronaVirus Visual Dashboard managed by Center for Systems Science and Engineering (CSSE) at Johns Hopkins University, also, Supported by ESRI Living Atlas Team and the Johns Hopkins University Applied Physics Lab (JHU APL).
6 The data fetched can be regarded as parameterized dataset having pertinent parameters including State, Country, Latitude count, Longitude count and dates. To take in account the data for Confirmed, Death and Recovered cases, separate dataset has been used. The dataset conscripted is continuous dataset and therefore, is well suited for regression Analysis as it needs to predict from continuous dependent variables from various independent ones. The relation between dependent and independent variables can be defined by coefficient of both variables in regression mathematical statement. Feature Selection It involves tailoring our data for best results from our model.
7 Feature Engineering can influence the performance of our model; thus, it is important to choose it precisely. Including impeccable and succinct feature can help us to know better about the framework of our data. The process includes delving and aggregating or decomposing required features to produce new characteristics or alter the provided ones and destigmatizing irrelevant parameters. To cope up with our prediction model, we have r e m o v e d s q u a n d e r e d p a r a m e t e r s s u c h a s Combined_key, Latitude count, Longitude count, FIPS. For further, easy processing we have converted the dates to date-time object using strptime().
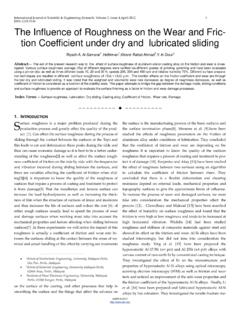
8 Regression Analysis To predict the future cases, causalities, recovery cases, we have employed Linear Polynomial Regression. Linear Regression is operated on two continuous variables to find relationship between them. Linear Polynomial Regression that can be seen in Fig 3. can be regarded as extended version of Linear Regression, it is implemented on related but non-linear data. It is supervised in nature, and handles non-linear data efficiently. Fig 3. Shows Simple and polynomial Linear Regression Implementation The data has been spitted in 4:1 for training and testing respectively. On implying degree=3, the model can show accuracy up to 71% for worldwide cases, for worldwide recovery cases and for death cases worldwide.
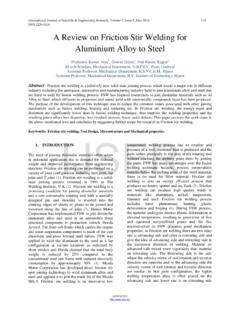
9 Fig 4. Shows the split of data for training & testing, and the accuracies obtained for different cases using polynomial linear regression. Fig 4. Shows the split of data for training & testing, and the accuracies obtained for different cases using polynomial linear regression in Python 2 International Journal of Scientific & Engineering Research Volume 11, Issue 12, December-2020 ISSN 2229-5518 1163 IJSER 2020 Cases : The model trained and tested using polynomial linear regression is used to predict the total number of cases on each day. Fig 5. shows the predicted values, and Fig 6. shows the comparison between test data and predicted values.
10 Fig 5. Shows the predicted values for total cases on each day Fig 6. Shows the comparison between test and predicted total values Predicting Recoveries : The model trained and tested using polynomial linear regression is used to predict the total number of recovered cases on each day. Fig 7. shows the predicted recovery values for each day, and Fig 8. shows the comparison between test data and predicted recovery values. Fig7. Shows the predicted recovery values for recovery cases on each day Fig 8. Shows the comparison between test data and predicted recovery values Predicting Deaths : The model trained and tested using polynomial linear regression is used to predict the total number of death cases on each day.