Transcription of CPGAN #035 Glass Transition by DMA ©Cambridge …
1 CPGAN #035 Glass Transition by DMA cambridge Polymer Group, Inc.(2014). All rights reserved 56 Roland Street, Suite 310 Boston, MA 02129 Office (617) 629-4400 Fax (617) 629-9100 Summary This application note describes the determination of the Glass Transition temperature Tg of a cured epoxy by dynamic mechanical analysis (DMA). The DMA results are compared to data obtained by differential scanning calorimetry (DSC), a commonly used alternative for measuring Glass Transition temperature. Background The Glass Transition temperature is the point at which a material changes from a stiff, glassy physical to a softer, more rubbery state. Physically, the Glass Transition temperature is the point at which polymer chains gain enough energy in order to substantially increase their mobility within the polymer matrix and this is reflected in a sharp change in material flexibility and an increase in the sample s heat capacity.
2 The Glass Transition temperature is a key property of epoxy systems and often defines the temperature range in which the epoxy may be used. Parameters that will affect the Glass Transition temperature of an epoxy system include the epoxy resin and hardener chemical structure, degree of cure, and moisture content. It is also a critical aspect of rubber performance since if you drop the temperature below the Glass Transition of the rubber polymer, it becomes brittle and rigid. This Transition was the cause of the Challenger disaster in 19861 because the ambient temperature prevented o-rings in the solid rocket boosters from sealing properly. Figure 1: Challenger disaster (source, NASA) Understanding the Glass Transition temperature can therefore be critical for determining material suitability for specific applications.
3 One of the most common methods for measuring a polymer s Glass Transition temperature (or commonly, its Tg) is by Differential Scanning Calorimetry (DSC), in which the changes in heat capacity through the Tg result in a sigmoidal change in the heat flow signal indicating that a Glass Transition has occurred. However, this technique often lacks the sensitivity to adequately identify the Glass Transition temperature, and in some cases may conclude that a material has no Glass Transition temperature at all. It can also be confounded in complex systems by other thermal transitions occurring in the material. An alternative common method for measuring Tg is by Dynamic Mechanical Analysis (DMA). In this test, the sample is subjected to an oscillatory stress, and the material response is measured.
4 The nature of this response may be used to determine the elastic and viscous properties of the material (storage modulus and loss modulus, respectively), and this can be very sensitive to Tg as the material rapidly becomes more flexible at the Transition temperature. A third parameter, tangent delta is defined as the ratio between the loss modulus and the storage modulus, and represents the relative contribution of the viscous vs. elastic properties. 1 CPGAN #035 Glass Transition by DMA cambridge Polymer Group, Inc.(2014). All rights reserved 56 Roland Street, Suite 310 Boston, MA 02129 Office (617) 629-4400 Fax (617) 629-9100 During a DMA experiment, the sample temperature is slowly scanned and the storage modulus, loss modulus, and tan delta are continuously measured.
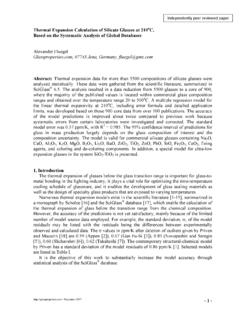
5 At the Glass Transition temperature, the storage modulus is observed to decrease sharply, and a peak is observed in both the loss modulus and tan delta signals. Procedure and Results Glass Transition temperature was determined by DMA and according to ASTM E1640-13. Specimens approximately 1 mm thick, 3 mm wide and 20 mm long were machined from a larger sample of cured epoxy. The specimen thickness and width were measured at three points along the specimen length using a Mitutoyo micrometer, and the average of these measurements was used for calculation of cross-sectional area. Length of specimens was measured by TA Instruments Q800 DMA. DMA testing was performed using a TA Instruments Q800 DMA. Specimens were mounted between film tension fixtures, as shown in Figure 2.
6 Figure 2: Instrument configuration for DMA measurements, with sample gripped between film tension fixtures. Red arrow is sample, orange arrows indicate clamps. Green arrow indicates the moving drive head. The fixture directly gripped the specimen approximately 5 mm from the end of the specimen length. Samples were tested under the following parameters: Test Mode: Strain Controlled Temperature Ramp Test Frequency: 1 Hz Preload: N Oscillation Amplitude: strain Temperature Program: Equilibrate at 0 C Isothermal at 0 C for 10 minutes Ramp 1 C/min from 0 C to 170 C The Glass Transition temperature was calculated using three different methods: as the extrapolated onset of the sigmoidal change in storage modulus (Tg), as the peak of the loss modulus signal (Tl), and as the peak of the tangent delta signal (Tt).
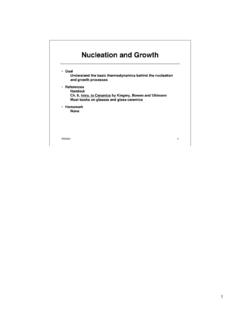
7 In most cases, the order of temperatures for a given material is Tg < Tl < Tt. CPGAN #035 Glass Transition by DMA cambridge Polymer Group, Inc.(2014). All rights reserved 56 Roland Street, Suite 310 Boston, MA 02129 Office (617) 629-4400 Fax (617) 629-9100 The storage modulus, loss modulus, and tan delta as a function of temperature are shown in Figure 2 and a summary of the measured Glass Transition temperatures is shown in Table 1. This particular sample shows a relatively broad tan delta peak, which is indicative of a wider range of polymer chain lengths and chain branching within the epoxy. This also demonstrates that the Glass Transition often occurs over a temperature range, rather than at a single well defined temperature. Figure 3: Storage modulus, loss modulus, and tan delta as a function of frequency of an epoxy sample.
8 Glass Transition temperature as determined by loss modulus peak and tangent delta peak are labeled above the respective traces. Table 1: Measured Glass Transition temperatures . Values are shown for Glass Transition temperature as determined by the extrapolated onset of the sigmoidal change in storage modulus, loss modulus peak, and tan delta peak. Storage Modulus Extrapolated Onset [ C] Loss Modulus Peak [ C] Tan Delta Peak [ C] For comparison, the same epoxy sample was also tested by Differential Scanning Calorimetry (DSC) using a TA Instruments Q2000 DSC. The instrument temperature and heat flow signals are calibrated to pure indium and bismuth and are verified on a daily basis with an indium standard. One specimen from each sample was sectioned using a clean razor blade, and then weighed on a calibrated precision balance (AND GR-202, ).
9 Specimens were crimped between a standard aluminum pan and lid, and an empty aluminum pan and lid were used as a reference. A 50 mL/min nitrogen purge was used. The test procedure is listed below: Equilibrate: C Isothermal: min Ramp Rate: C/min to C Isothermal: min Ramp Rate: C/min to C Isothermal: min Ramp Rate: C/min to C CPGAN #035 Glass Transition by DMA cambridge Polymer Group, Inc.(2014). All rights reserved 56 Roland Street, Suite 310 Boston, MA 02129 Office (617) 629-4400 Fax (617) 629-9100 Only the first heat curve of each specimen was analyzed in TA Universal Analysis 2000 to determine the Glass Transition temperature Tg, defined as the center-point of a sigmoidal change in the heat flow signal.
10 The thermogram of the first heating cycle of the epoxy material is shown in Figure 4. Based on this data, the sample does not appear to have any distinct Glass transitions (although there are two suggestions of a Transition around and C). Figure 4: Thermograms showing the first heating cycles of an epoxy sample. While an initially endothermic slope leading to a horizontal plateau is indicative of a Glass Transition having occurred (caused by an increase in the specific heat of the material), the breadth of this Transition and the lack of a clear step change makes it difficult to determine the Tg accurately and consistently. In comparison, the DMA test method is substantially more sensitive to the temperature-dependent physical properties in the material and is the preferred tool for measuring the Glass Transition temperature for this application.