Transcription of Criminal Victimization, 2020 – Supplemental Statistical Tables
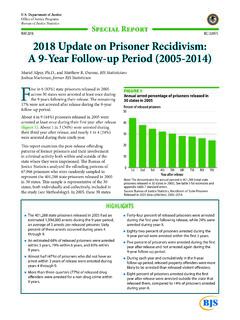
1 Department of Justice Office of Justice Programs Bureau of Justice Statistics February 2022, NCJ 303936. Criminal victimization , 2020 . Bureau of Justice Statistics Statistical Tables Supplemental Statistical Tables Rachel E. Morgan, , and Alexandra Thompson, BJS Statisticians T. he prevalence of violent crime in the robbery, aggravated assault, and simple assault. United States declined from The percentage of persons who were victims ( million) of persons age 12 or older in of violent crime excluding simple assault 2019 to ( million) in 2020 (figure 1). also declined during this period, from Violent crime includes rape or sexual assault, ( million) to ( million). FIGURE 1. Percent of persons age 12 or older who were victims of violent crime and violent crime excluding simple assault, 1993 2020.
2 Violent crime Violent crime excluding simple assault 1993 1995 2000 2005 2010 2015 2020. Note: Estimates include 95% confidence intervals. See table 1 for definitions and appendix table 1 for estimates and standard errors. Estimates for 2006 should not be compared to other years and are excluded from the figure. Source: Bureau of Justice Statistics, National Crime victimization Survey, 1993 2020. Highlights The percentage of persons age 12 or older who Most violent incidents against white (69%). were victims of violent crime declined 15%, from and black (66%) victims were committed by an ( million) in 2019 to ( million) offender of the same race or ethnicity as the victim. in 2020. From 2019 to 2020, the percentage of intimate The prevalence of property crime declined from partner violent victimizations for which victims ( million) of households in 2019 to received victim services decreased by more than ( million) in 2020.
3 Half, from 26% to 12%. Regardless of the victims' sex, a greater The rate of violent victimization committed percentage of violent incidents involved male against citizens was lower in 2020. offenders (79%) than female offenders (17%) or ( victimizations per 1,000 citizens) than offenders of both sexes (3%). in 2019 ( per 1,000). List of Tables Appendix table 2. Standard errors for table 1: Number and percent of persons who were victims Table 1. Number and percent of persons who of violent crime, by type of crime, 2016 2020. were victims of violent crime, by type of crime, 2016 2020 Appendix table 3. Standard errors for table 2: Number and percent of persons who were victims Table 2. Number and percent of persons who of violent crime, by demographic characteristics of were victims of violent crime, by demographic victims, 2019 and 2020.
4 Characteristics of victims, 2019 and 2020. Appendix table 4. Standard errors for table 3: Table 3. Number and percent of households that Number and percent of households that were were victims of property crime, by type of crime, victims of property crime, by type of crime, 2016 2020 2016 2020. Table 4. Percent of violent incidents, by sex of Appendix table 5. Standard errors for table 4: victims and offenders, 2020 Percent of violent incidents, by sex of victims and offenders, 2020. Table 5. Percent of violent incidents, by race or ethnicity of victims and offenders, 2020 Appendix table 6. Standard errors for table 5: Percent of violent incidents, by race or ethnicity of Table 6. Percent of violent victimizations for victims and offenders, 2020.
5 Which victims received assistance from a victim service provider, by type of crime, 2019 and 2020 Appendix table 7. Standard errors for table 6: Percent of violent victimizations for which victims Table 7. Number and rate of violent victimization , received assistance from a victim service provider, by veteran and citizenship status of victims, 2019 by type of crime, 2019 and 2020. and 2020. Appendix table 8. Standard errors for table 7: Table 8. Percent and rate of violent victimization Number and rate of violent victimization , by reported to police, by demographic characteristics veteran and citizenship status of victims, 2019. of victims, 2019 and 2020 and 2020. List of figures Appendix table 9. Standard errors for table 8: Percent and rate of violent victimization reported Figure 1.
6 Percent of persons age 12 or older who to police, by demographic characteristics of were victims of violent crime and violent crime victims, 2019 and 2020. excluding simple assault, 1993 2020. Appendix table 10. Population of persons age 12 or older, by demographic characteristics, List of appendix Tables 2016 2020. Appendix table 1. Estimates and standard Appendix table 11. Population of households, errors for figure 1: Percent of persons age 12 or 2016 2020. older who were victims of violent crime and violent crime excluding simple assault, 1993 2020. Criminal victimization , 2020 Supplemental Statistical Tables | February 2022 2. Findings are based on the National Crime victimization Prevalence estimates Survey (NCVS), a self-report survey administered annually from January 1 to December Annual NCVS Prevalence of violent crime estimates are based on the number and characteristics The prevalence of violent crime declined from of crimes that respondents experienced during the prior ( million) of persons age 12 or older in 2016 to 6 months, excluding the month in which they were ( million) in 2020 (table 1).
7 2 This change interviewed. Therefore, the 2020 survey covers crimes was primarily driven by a decline in the prevalence experienced from July 1, 2019 to November 30, 2020, of assault during this period, from to with March 15, 2020 as the middle of the reference period. Crimes are classified by the year of the survey From 2016 to 2020, the percentage of persons who and not by the year of the crime. (See Methodology.) were victims of aggravated assault declined from 1 See Criminal victimization , 2020 (NCJ 301775, BJS, October 2021) to The percentage who were victims of for details on adjustments to the 2020 NCVS weighting procedures simple assault declined from in 2016 to and 2020 NCVS estimates not included in this report.
8 In 2020. The prevalence rate of violent crime with a weapon declined from in 2019 to in 2020. 2 Prevalence reflects the number or percentage of unique persons who were crime victims, or of unique households that experienced crime. 3In this report, Statistical significance is reported at both the 90% and 95% confidence levels. See figures and Tables for testing on specific findings. TablE 1. Number and percent of persons who were victims of violent crime, by type of crime, 2016 2020. Number of victimsa Percent of personsb Type of crime 2016 2017 2018 2019 2020* 2016 2017 2018 2019 2020*. Total violent crimec 2,882,320 3,106,340 3,254,250 3,059,060 2,599,620 Rape/sexual assault 162,940 208,960 347,090 212,230 192,820 Robbery 312,310 402,430 363,210 337,720 306,410 Assault 2,497,500 2,595,780 2,668,820 2,586,170 2,176,320 Aggravated assault 680,770 646,540 694,260 697,190 556,010 Simple assault 1,903,860 2,024,880 2,058,870 1,965,410 1,685,000 Violent crime excluding simple assaultd 1,123,190 1,225,800 1,367,270 1,216,400 1,026,020 Selected characteristics of violent crime Domestic violencee 514,350 559,820 636,540 521,870 454,330 Intimate partner violencef 273,900 308,560 368,980 310,320 253,170 Stranger violence 1,276,710 1,370,020 1,411,500 1,393,650 1,243.
9 930 Violent crime with an injury 663,920 722,560 841,280 735,430 667,230 Violent crime with a weapon 767,320 776,770 838,630 788,920 651,000 Note: Details may not sum to totals because a person may experience multiple types of crime. Violent crime categories include rape or sexual assault, robbery, aggravated assault, and simple assault, and they include threatened, attempted, and completed occurrences of those crimes. Violent crime categories such as domestic violence and violent crime with an injury are not mutually exclusive from other violent crime categories or from other characteristics. See appendix table 2 for standard errors and appendix table 10 for person populations. *Comparison year. Difference with comparison year is significant at the 95% confidence level.
10 Difference with comparison year is significant at the 90% confidence level. aNumber of persons age 12 or older who experienced at least one violent victimization during the year. bPercentage of persons age 12 or older who experienced at least one violent victimization during the year. cExcludes homicide because the National Crime victimization Survey is based on interviews with victims. dIncludes rape or sexual assault, robbery, and aggravated assault. eIncludes the subset of violent victimizations that were committed by intimate partners or family members. fIncludes the subset of violent victimizations that were committed by current or former spouses, boyfriends, or girlfriends. Source: Bureau of Justice Statistics, National Crime victimization Survey, 2016 2020.