Transcription of Critical Path Analysis & PERT Charts (taken from www ...
1 Critical path Analysis & PERT Charts (taken from - Planning and scheduling more complex projects Critical path Analysis and PERT are powerful tools that help you to schedule and manage complex projects. They were developed in the 1950s to control large defense projects, and have been used routinely since then. As with Gantt Charts , Critical path Analysis (CPA) helps you to lay out all tasks that must be completed as part of a project. They act as the basis both for preparation of a schedule, and of resource planning. During management of a project, they allow you to monitor achievement of project goals.)
2 They help you to see where remedial action needs to be taken to get a project back on course. The benefit of using CPA over Gantt Charts is that Critical path Analysis formally identifies tasks which must be completed on time for the whole project to be completed on time, and also identifies which tasks can be delayed for a while if resource needs to be reallocated to catch up on missed tasks. The disadvantage of CPA is that the relation of tasks to time is not as immediately obvious as with Gantt Charts . This can make them more difficult to understand for someone who is not familiar with the technique.
3 A further benefit of Critical path Analysis is that it helps you to identify the minimum length of time needed to complete a project. Where you need to run an accelerated project, it helps you to identify which project steps you should accelerate to complete the project within the available time. This helps you to minimize cost while still achieving your objective. How to use the tool: As with Gantt Charts , the essential concept behind Critical path Analysis is that you cannot start some activities until others are finished. These activities need to be completed in a sequence, with each stage being more-or-less completed before the next stage can begin.
4 These are 'sequential' activities. Other activities are not dependent on completion of any other tasks. You can do these at any time before or after a particular stage is reached. These are non-dependent or 'parallel' tasks. Drawing a Critical path Analysis Chart Use the following steps to draw a CPA Chart: 1. List all activities in the plan For each activity, show the earliest start date, estimated length of time it will take, and whether it is parallel or sequential. If tasks are sequential, show which stage they depend on. For the project example used here, you will end up with the same task list as explained in the article on Gantt Charts (we will use the same example as with Gantt Charts to compare the two techniques).
5 The chart is repeated in figure 1 below: Figure 1. Task List: Planning a custom-written computer project NB: The start week shows when resources become available. Whether a task is parallel or sequential depends largely on context. Task Possible start Length Type Dependent 1. High level Analysis week 1 5 days sequential 2. Selection of hardware platform week 1 1 day sequential 1 3. Installation and commissioning of hardware week 3 2 weeks parallel 2 4. Detailed Analysis of core modules week 1 2 weeks sequential 1 5. Detailed Analysis of supporting utilities week 1 2 weeks sequential 4 6.
6 Programming of core modules week 4 3 weeks sequential 4 7. Programming of supporting modules week 4 3 weeks sequential 5 8. Quality assurance of core modules week 5 1 week sequential 6 9. Quality assurance of supporting modules week 5 1 week sequential 7 module training week 7 1 day parallel 6 of accounting reporting week 6 1 week parallel 5 of management reporting week 6 1 week parallel 5 of management Analysis week 6 2 weeks sequential 5 training week 7 1 week sequential 1-13 week 4 2 weeks parallel 13 2. Plot the activities as a circle and arrow diagram Critical path Analyses are presented using circle and arrow diagrams.
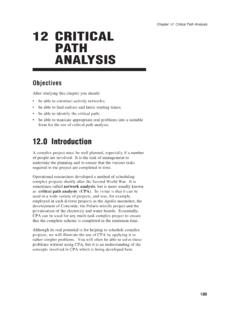
7 In these, circles show events within the project, such as the start and finish of tasks. Circles are normally numbered to allow you to identify them. An arrow running between two event circles shows the activity needed to complete that task. A description of the task is written underneath the arrow. The length of the task is shown above it. By convention, all arrows run left to right. An example of a very simple diagram is shown below: This shows the start event (circle 1), and the completion of the 'High Level Analysis ' task (circle 2). The arrow between them shows the activity of carrying out the High Level Analysis .
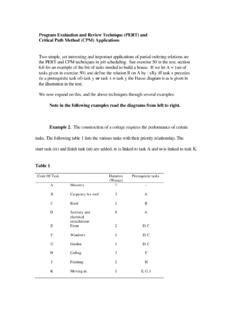
8 This activity should take 1 week. Where one activity cannot start until another has been completed, we start the arrow for the dependent activity at the completion event circle of the previous activity. An example of this is shown below: Here the activities of 'Selecting Hardware' and 'Core Module Analysis ' cannot be started until 'High Level Analysis ' has been completed. This diagram also brings out a number of other important points: Within Critical path Analysis , we refer to activities by the numbers in the circles at each end. For example, the task 'Core Module Analysis ' would be called 'activity 2 to 3'.
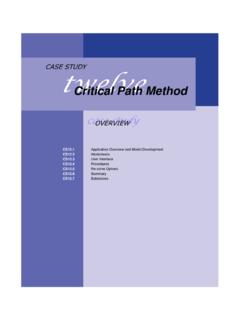
9 'Select Hardware' would be 'activity 2 to 4'. Activities are not drawn to scale. In the diagram above, activities are 1 week long, 2 weeks long, and 1 day long. Arrows in this case are all the same length. In the example above, you can see numbers above the circles. These show the earliest possible time that this stage in the project will be reached. Here units are whole weeks. A different case is shown below: Here activity 6 to 7 cannot start until the other three activities (12 to 6, 5 to 6 and 9 to 6) have been completed. See figure 5 for the full circle and arrow diagram for the computer project we are using as an example.
10 Click here to see the full Critical path Diagram This shows all the activities that will take place as part of the project. Notice that each event circle has a figure below it as well as a figure above. This shows the latest time that it can be reached with the project still being completed in the minimum time possible. You can calculate this by starting at the last event (in this case number 7), and working backwards. You can see that event 4 can be completed any time between weeks in and weeks in. The timing of this event is not Critical . Events 1 to 2, 2 to 3, 3 to 4, 4 to 5, 5 to 6 and 6 to 7 must be started and completed on time if the project is to be completed in 10 weeks.