Transcription of Current Employment Statistics Highlights July 2018
1 Current Employment Statistics Highlights Detailed Industry Employment Analysis Contents Current Employment Statistics Summary Mining & Logging Highlights Construction Manufacturing Wholesale Trade Retail Trade Transportation, Warehousing, & Utilities Information Financial Activities Professional & Business Services Private Education & health Services Leisure & Hospitality January 2018 . Other Services Release Date: February 2, 2018 . Government Prepared by Analysts of the National Estimates Branch Current Employment Statistics Survey Bureau of Labor Statistics 202-691-6555. Email CES. CES Highlights Release Date: February 2, 2018 . Current Employment Statistics Summary, January 2018 . Nonfarm payroll Employment increased by 200,000 in January. Employment continued to Employment in total nonfarm Over-the-month change, January 2015 January 2018 .
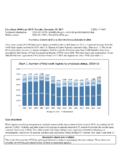
2 Trend up in construction, food services, health Seasonally adjusted, in thousands 400. care, and manufacturing. 351. 350. 326 325. Average hourly earnings of all employees 300 285. on private, nonfarm payrolls increased by 9 267. 282. 264 264. 271. 256 257 259. cents or percent over the month. Hourly 250 234 235 239. 221. earnings have risen percent over the year. 211 216. 200 200. 200 191 190. Average weekly hours decreased hour in 174 175 172. 180 175. 164 160. January. 150 140. 155. 103. In accordance with annual practice, 100. 78. 88. 73. establishment survey data have been revised 50 34. to reflect comprehensive counts of payroll 14. jobs, or benchmarks, derived principally from 0. Jan-15 Jul-15 Jan-16 Jul-16 Jan-17 Jul-17 Jan-18. the Quarterly Census of Employment and Over-the-month change Annual average Wages, which enumerates jobs covered by Bureau of Labor Statistics , Current Employment Statistics , February 02, 2018 .
3 Most recent 2 months of data are preliminary. unemployment insurance tax records. Nonfarm Employment for March 2017 was +216,000. These monthly revisions reflect the the past 12 months, construction has revised up by 138,000 on a not seasonally incorporation of additional sample, as well as added 226,000 jobs. adjusted basis. For an analysis of the updated benchmarks, net birth-death factors, benchmark revisions, see and seasonal adjustment models. +35,000 Leisure and Hospitality Employment in food services continued to +36,000 Construction trend up in January (+31,000). Over the past The Employment change for December Construction Employment rose by 36,000 in 12 months, the industry added 255,000 jobs, (seasonally adjusted) revised up from January, with specialty trade contractors down from an increase of 312,000 over the +148,000 to +160,000, and the change for accounting for 26,000 of the increase.
4 Over prior 12 months. November revised down from +252,000 to Private Trade: Transp., Professional Mining & Financial Education Leisure & Other Summary Construction Manufacturing Wholesale Warehousing Information & Business Government Logging Activities & health Hospitality Services Retail & Utilities Services Services CES Highlights Release Date: February 2, 2018 . Current Employment Statistics Survey Summary, January 2018 . +38,000 Education and health Services Employment in total nonfarm Total nonfarm: 200*. Over-the-month change, January 2018 . health care Employment continued to trend Seasonally adjusted, in thousands up in January (+21,000). Over the past 12 6. Mining and logging months, Employment in the industry has 36. Construction*. increased by an average 25,000 per month, 15. Manufacturing down from 29,000 during the prior 12 months.
5 10. Wholesale trade 15. Retail trade +15,000 Manufacturing 11. Transportation and warehousing Over the month, manufacturing -1. Utilities Employment continued to trend up (+15,000), -6. Information 9. in line with the prior 12-month average Financial activities 23. change. In January, a gain of 18,000 jobs was Professional and business services 38. widely distributed among durable goods Education and health services 35. industries. Leisure and hospitality 6. Other services 4. Government +15,000 Retail Trade Within retail trade, clothing and clothing -20 -10 0 10 20 30 40 50. January 2018 Prior 12-month average accessories stores added 15,000 jobs in Bureau of Labor Statistics , Current Employment Statistics survey, February 02, 2018 . Data are preliminary. January, mostly offsetting losses over the prior * denotes significance 2 months.
6 Employment changed little over the month elsewhere in retail trade. +10,000 Wholesale Trade +23,000 Professional and Business Services +11,000 Transportation and Warehousing Employment in wholesale trade continued Employment in professional and business Within transportation and warehousing, to edge up in January. The industry has added services changed little over the past 3 months, couriers and messengers added 5,000 jobs in an average 6,000 jobs per month over the past averaging +21,000 per month. Job growth in January, consistent with trend over the 12 months, compared to 2,000 per month the industry had averaged 38,000 per month preceding 12 months. over the prior 12 months. over the preceding 12 months. Private Trade: Transp., Professional Mining & Financial Education Leisure & Other Summary Construction Manufacturing Wholesale Warehousing Information & Business Government Logging Activities & health Hospitality Services Retail & Utilities Services Services CES Highlights Release Date: February 2, 2018 .
7 Mining and Logging Employment in mining and logging grew Employment in mining by 6,000 in January. Mining contributed January 2008 January 2018 5,000 jobs. Seasonally adjusted, in thousands 950. Economic indicators continued to suggest growth in the mining industry. 900 January 2018 Level: 653 Domestic oil rigs numbered 939 in January, OTM Change: 5. up 1 percent from December. West Texas 850. Intermediate oil prices rose percent 800 from the previous month to $ per barrel in January. Since reaching a trough 750. in October 2016, mining Employment has 700 risen by 59,000. 650. 600. 550. 500. Jan-08 Jan-10 Jan-12 Jan-14 Jan-16 Jan-18. Bureau of Labor Statistics , Current Employment Statistics survey, February 02, 2018 . Shaded area represents recession as denoted by the National Bureau of Economic Research. Most recent 2 months of data are preliminary.
8 * denotes significance Private Trade: Transp., Professional Mining & Financial Education Leisure & Other Summary Construction Manufacturing Wholesale Warehousing Information & Business Government Logging Activities & health Hospitality Services Retail & Utilities Services Services CES Highlights Release Date: February 2, 2018 . Construction Construction Employment rose by 36,000 in Employment in construction January. Specialty trade contractors led the January 2008 January 2018 growth by adding 26,000 jobs, with a majority Seasonally adjusted, in thousands being in residential specialty trade contractors 8,000 (+14,000). Construction has added 226,000. jobs over the past 12 months. 7,500. January 2018 Level: 7,099. OTM Change: 36*. 7,000. 6,500. 6,000. 5,500. 5,000. 4,500. Jan-08 Jan-10 Jan-12 Jan-14 Jan-16 Jan-18. Bureau of Labor Statistics , Current Employment Statistics survey, February 02, 2018 .
9 Shaded area represents recession as denoted by the National Bureau of Economic Research. Most recent 2 months of data are preliminary. * denotes significance Private Trade: Transp., Professional Mining & Financial Education Leisure & Other Summary Construction Manufacturing Wholesale Warehousing Information & Business Government Logging Activities & health Hospitality Services Retail & Utilities Services Services CES Highlights Release Date: February 2, 2018 . Manufacturing Employment in manufacturing Employment in manufacturing continued to trend up in January Over-the-month change, January 2015 January 2018 (+15,000), in line with the prior 12-month average. Over the past 12. Seasonally adjusted, in thousands 50. months, the industry has added 186,000 jobs. In recent months, job gains 40. 39. in durable goods manufacturing have driven Employment gains in topside 30.
10 30 manufacturing. 24. 21 21 20 21. 20 18 18. 12. 15. 13 14. 12. 14 15 In January, durable goods manufacturing added 18,000 jobs, while 10 10. 10. 5 5 5 6 6 6. Employment in nondurable goods changed little (-3,000). Within durable 4 4. 0. 2. goods, machinery (+5,000) and transportation equipment (+6,000). -1. -4 -3 -4. accounted for roughly 62 percent of the over-the-month change. -10 -7. -9. Employment changes in most other component industries were close to -20 -17. -19 -18 their prior 12-month averages. -24. -30. Jan-15 Jul-15 Jan-16 Jul-16 Jan-17 Jul-17 Jan-18. Over-the-month change Annual average Bureau of Labor Statistics , Current Employment Statistics , February 02, 2018 . Most recent 2 months of data are preliminary. Employment in durable goods Durable goods: 18*. Over-the-month change, January 2018 . Seasonally adjusted, in thousands 1.
