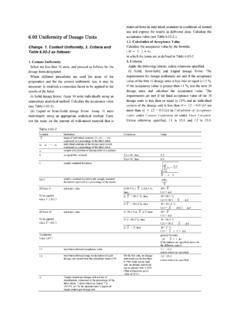
Transcription of Current Events in Blend and Content Uniformity
1 Reprinted from PHARMACEUTICAL ENGINEERING. THE OFFICIAL TECHNICAL MAGAZINE OF ISPE. MARCH/APRIL 2014, VOL 34, NO 2. product development Copyright ISPE 2014. Stratified Sampling Current Events in Blend and Content Uniformity by James S. Bergum, PhD, James K. Prescott, Ravindra W. Tejwani, Thomas P. Garcia, PhD, Jon Clark, and William Brown This article presents a summary of the stratified sampling session held at the 2013 ISPE Annual Meeting. I n 1999, the Product Quality Research Institute (PQRI) provide a summary of that session. Note that some presenta- established the Blend Uniformity Working Group. The tions are not summarized here, in cases where permissions purpose of this group was to make scientifically based for publication were not granted. recommendations on suitable procedures to ensure Blend and Content Uniformity of a batch. The recom- Basis for the Withdrawal of the Draft mendation had to comply with 21 CFR Sampling Guidance Document and Testing of In-Process Materials and Drug Prod- The primary reason for the withdrawal of the draft guidance ucts,1 which require in-process testing for adequacy document was that Sections V and VII no longer represent of of mix.
2 The recommendation provided an alternative the Agency's Current thinking. Section V recommended tak- approach to assess Blend Uniformity from that described in ing at least three replicate samples from at least 10 locations the former FDA guidance document, Blend Uniformity is- within the blender. However, the guidance only required sued by the Office of Generic On 31 December 2002, that one sample from each location be evaluated to assess PQRI submitted the group's final recommendation to the Blend Uniformity as part of first stage testing. The FDA's FDA,3 which formed the basis for the FDA draft guidance Current preference is to analyze all three replicates from for industry, Powder Blends and Finished dosage Units each The use of nested sampling plans and testing Stratified In-Process dosage unit Sampling and Assess- of replicate samples from each location allows the data to be ment, issued October, 20034 hereafter referred to as the subjected to Variance Component Analysis.
3 This statistical draft guidance document. Although the draft guidance docu- technique divides the total variance into between location . ment was never finalized, it was extensively used throughout (the amount of variability across the sampling locations in the pharmaceutical industry. On 7 August 2013 the FDA a blender, or during a compression, encapsulation or filling withdrew the draft guidance document because it was no process), and within location (the amount of variability longer consistent with Current Agency ,6 between samples within a given sampling location). High A group of individuals from the FDA, academia, and in- between location variances often indicate poor mixing and dustry (sponsored by the International Society for Pharma- non- Uniformity within the blender, and also can imply non- ceutical Engineering (ISPE)) formed to discuss alternative Uniformity or segregation during dosage form manufacture. approaches to assess Blend and Content Uniformity (BUCU) High within location variances can be indicative of sampling Group.
4 This group sponsored a session at the ISPE Annual bias (for blends) or incomplete mixing on a unit dose scale. Meeting on 6 November 20137 to discuss the concerns that Both variances are indicative of the quality of the batch. lead to the withdrawal of the draft guidance document. The The number of samples and the acceptance criteria session also included presentations for potential alternative contained in Section VII (Routine Manufacturing Batch approaches for the assessment of Blend and Content unifor- Testing Methods) were based upon the limits published in mity of solid dosage forms. The purpose of this article is to the United States Pharmacopeia (USP) General Chapter PHARMACEUTICAL ENGINEERING MARCH/APRIL 2014 1. product development Stratified Sampling <905> Uniformity of dosage This was intentional (for example, first 1/3, middle 1/3, and final 1/3). The to avoid any changes to the existing quality standard or an combination of all strata covers the entire batch.
5 Then increase in the number of dosage units to be tested. The use random sampling is performed within each stratum. of stratified sampling plans resulted in increased confidence Systematic Sampling: samples are taken at equal for the Uniformity of the batch, because sample locations intervals throughout the batch. The first sample location target problematic areas prone to segregation or incomplete is determined at random in the first interval then the mixing. USP <905> Uniformity of dosage Forms does not remaining samples are taken at equal intervals from that include a statistical sampling plan and is only intended to point. determine conformance of a defined sample. FDA's position is the results from USP <905> Uniformity of dosage Units Typically for both simple random and stratified sampling, provide limited assurance that the batch meets specifications only one dosage unit is tested at each location which is called and statistical quality control criteria. [CGMP also requires Sampling Plan 1.]
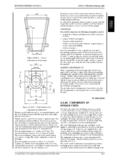
6 If greater than one dosage unit is taken sampling plans to be scientifically sound and representative at each location, the plan is referred to as Sampling Plan 2. of the entire batch (21 CFR (b)).] The FDA cited more Suppose 12 dosage units are taken from a batch and tested statistically sound sampling plans and acceptance criteria based on a systematic sampling plan using Sampling Plan 1. that can be used to ensure the batch complies with Current The variability in the results could be due to different loca- CGMPs, including 21 CFR , Sampling and Testing of tions or just the natural variability had all units been taken In-Process Materials and Drug Products, 21 CFR from the same location. General Requirements [Subpart I, Laboratory Controls] and Figure 1 shows what the data would look like in the case 21 CFR Testing and Release [of the finished drug where there is location to location variation (top half) and product] for where there is no location to location variation (bottom A science- and risk-based approach should be used to half).
7 Assess Blend and Content Uniformity . Although powder thief In the upper portion of the plot where there is location sampling has known limitations, the FDA encourages indus- to location variation, the results at each location are similar, try to continue using the technique to assess Blend unifor- but there is variation between the locations. In the lower mity (and identify errors when they exist), as well as more portion of the plot where there is no statistically discernible innovative approaches such as NIR9 and Statistical Process location to location variability, the within location variability Control (SPC) to assess Blend Uniformity . The technique(s) is as variable as the variability between the locations. that companies choose to assess Blend or Content unifor- mity should be justified, including the number and size of ASTM E2709/E2810. samples, the position of probes, and the amount of sample The USP Uniformity of dosage Units (UDU) given in Gen- measured. eral Chapter <905> Uniformity of dosage Units of the USP.
8 The FDA recommends the use of stratified sampling UDU test is a market standard and is not intended for in- plans when the batch contains locations that may have dif- specting Uniformity of finished product for lot/batch release ferent results for a measured quality characteristic. The ex- or as a lot inspection procedure. Passing the UDU test once pectation is for the product quality to be consistent through- does not provide statistical assurance that a batch of drug out the entire batch with no significant differences existing product will meet specified statistical quality control criteria. between locations. ASTM E270910 and ASTM E281011 can be referenced for establishing acceptance criteria for a stratified sampling plan. Sampling Plans and Statistical Methods for Process Validation (Jim Bergum). Sampling Plans A sampling plan describes where (locations) and how the samples are taken from the Blend or batch, and the number of samples ( Blend amount or dosage units) taken from each location.
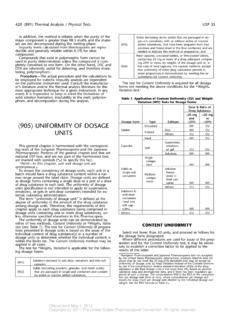
9 The most common plans are given below: Simple Random Sampling: each dosage unit has an equal probability of being chosen as a member of the units to be tested and are picked completely at random. Figure 1. Batch data with and without location variability (CU vs. Stratified Sampling: partitions the batch into strata Location). 2 MARCH/APRIL 2014 PHARMACEUTICAL ENGINEERING. product development Stratified Sampling a lot mean of 98% with a lot standard deviation of 3%. The dashed horizontal reference line is at 95% in the figure. So if we want a good chance of passing the acceptance limit table, a sample size of 30 would be reasonable. Sampling Plan 2 is generally a sys- tematic sample where more than one dosage unit is tested from each location. Suppose that a batch is sampled at 15. locations evenly distributed throughout the batch and four tablets are tested at each location. The statistics required to use the ac- ceptance limit table for Sampling Plan 2. Figure 2. OC curves for Sampling Plan 1 (OC Curve = Prob (Passing Acceptance Limit Table are the overall mean, the within-location for Specific Lot Mean and Standard Deviation)).
10 Standard deviation and the standard deviation of the location means. Suppose A methodology was developed by James Bergum12 and these values are , , and , respectively. updated by Bergum and Li13 to provide this assurance that The acceptance limit table for Sampling Plan 2 contains resulted in the following standards: ASTM E2709, Standard limits for the overall mean for various combinations of the Practice for Demonstrating Capability to Comply with an within-location and location mean standard deviation. If the Acceptance Procedure and E2810, Standard Practice for acceptance limit table in this example was constructed using Demonstrating Capability to Comply with the Test for Uni- 90% Confidence with 95% coverage, the lower and upper formity of dosage Units. ASTM E2709 provides the general limits on the overall mean are to Since the methodology and E2810 applies the methodology specifi- overall mean in our sample is , the sample passes cally to the UDU test. The goal is to develop limits based on the limits.