Transcription of Daman Morning - Daman Securities
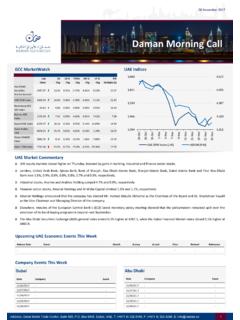
1 11 October 2017. Daman Morning Call GCC MarketWatch UAE Indices 3,679 4,504. Last 1D 1D % YTD% 1M % 1Y % P/E. Close Chg Chg Chg Chg Chg Multiple (x). Abu Dhabi Securities 3,641 4,472. Market General UAE DFM Index 3,603 4,440. Bloomberg GCC. 200 Index Bahrain BSE. index 3,565 4,407. Kuwait KSE Index Saudi Arabia 3,528 4,375. 10-Oct 10-Sep 12-Sep 14-Sep 18-Sep 20-Sep 24-Sep 26-Sep 28-Sep 2-Oct 4-Oct 8-Oct TASI. Oman MSM30. Index UAE DFM Index (LHS) ADSMI (RHS). Qatar DSM Index UAE Market Commentary UAE equity markets closed mixed yesterday, as gains in finance and industrial sector stocks were overshadowed by losses in property and insurance sector stocks.
2 Financial stocks, SHUAA Capital, Al Waha Capital, Amanat Holdings, Gulf General Investment Co and Dar Al Takaful rose , , , and , respectively. Industrial stocks, Gulf Navigation Holding, National Marine Dredging Co, Drake & Scull International and Aramex surged , , and , respectively. On the losing side, real estate sector stocks, Eshraq Properties Co, Union Properties, Deyaar Development, Emaar Properties and DAMAC Properties Dubai Co fell , , , and , respectively. Insurance companies, Takaful Emarat Insurance, Dubai Islamic Insurance & Reinsurance Co and Islamic Arab Insurance Co eased , and , respectively. Elsewhere, in the UK, industrial production rose higher- than-expected in August, while the total trade deficit widened more-than-expected in August.
3 Further, the NIESR estimated gross domestic product rose in the July-September 2017 period. The Abu Dhabi Securities Exchange (ADX) general index ended higher at 4, , while the Dubai Financial Market index closed lower at 3, Upcoming UAE Economic Events This Week Release Date Event Month Survey Actual Prior Revised Relevance - - - - - - - - Company Events This Week Dubai Abu Dhabi Date Company Event Date Company Event 10/9/2017 - - 10/9/2017 - - 10/10/2017 - - 10/10/2017 - - 10/11/2017 Dubai Islamic Bank PJSC Q3 10/11/2017 Abu Dhabi Ship Building Company PJSC, Al Buhairah Q3. 10/12/2017 - - 10/12/2017 Invest bank PSC, United National Bank PJSC Q3. Address: Dubai World Trade Center, Suite 600, Box 9436, Dubai, UAE, T: (+971 4) 332 4140, F: (+971 4) 332 4240, E: 1.
4 Technical Picks Amlak Finance The stock traded in the red in the last session and closed at O: H: L: C: SMAVG (20) on Close SMAVG (100) on Close , after making a low at Even though the daily MACD is heading upwards, the RSI and stochastic indicators are showing loss of upward potential, reflecting at a bearish technical scenario. Important support is seen at the 20day SMA (currently trading at ), followed by the level and the daily lower Bollinger band (currently trading at ). A breach below the latter might lead to further bearish pressure on the stock. 100. However, the weekly momentum oscillators are trading with 50 a slightly positive showing, suggesting that the room for Relative Strength Index (RSI)(14).
5 0 upside still exists. Key resistance is placed at the 200day SMA. %K(9) %D(5). (currently trading at ), followed by the level 100. and the daily upper Bollinger band (currently trading at 50. ). 0. Apr-17 May-17 Jun-17 Jul-17 Sep-17 Oct-17. Emaar Properties The stock traded lower in the previous session and finished SMAVG (20) on Close SMAVG (100) on Close O: H: L: C: at , after touching a low at Currently, the weekly RSI and stochastic oscillators are tranquil above their 50lines, hinting at the bullish momentum in the coming week. However, the daily momentum oscillators are trading with a downside bias, indicating a likely correction in the near term.
6 Moreover, a potential signal line crossover from above by the weekly MACD, further endorses the bearish view. 100. Key support is positioned at the 50day SMA (currently placed 50 at ), followed by the and levels. A. Relative Strength Index (RSI)(14). 0 move back below the latter might lead to further negativity %K(9) %D(5). in the stock. 100. Meanwhile, important resistance is located at the 20day 50. SMA (currently placed at ), followed by the 0. Apr-17 May-17 Jun-17 Jul-17 Sep-17 Oct-17 and levels. A break above the latter might trigger strength in the stock. Gulf General Investment Co Following a daily upper Bollinger band crossover on Monday, SMAVG (20) on Close SMAVG (100) on Close O: H: L: C: the stock posted mild losses in the prior session and settled at , after touching a low at With the daily MACD sharply heading upwards and the RSI.
7 Placed near its overbought region, the near-term technical outlook appears to be bullish. In addition, the weekly RSI and stochastic indicators are trading at a higher level above their midlines, further validating the above outlook. The key technical barrier is situated at the level, 100 followed by the and the 200day SMA (currently placed at ). A surge above the latter might lead to 50. Relative Strength Index (RSI)(14). bullish momentum in the stock. 0. On the contrary, key support is observed at the %K(9) %D(5). 100 level, followed by the and levels. A. 50 breach below the latter might trigger further bearishness in 0 the stock. Apr-17 May-17 Jun-17 Jul-17 Sep-17 Oct-17.
8 2. Technical Picks Takaful House The stock traded with a bullish tone in the last session and SMAVG (20) on Close SMAVG (100) on Close O: H: L: C: ended at A recent signal line crossover from below by the daily MACD, along with the RSI and stochastic trading with a positive showing, hints the presence of bullish momentum in the coming session. On the weekly chart, the RSI and stochastic are attempting to move out of their oversold regions, further substantiating the above view. Immediate resistance resides at the level, followed 100. by the 20day SMA (currently located at ) and 50. levels. A break and stability above the latter might Relative Strength Index (RSI)(14).
9 0. trigger a further acceleration to the upside. %K(9) %D(5). On the other hand, crucial support is seen at the 100. level, followed by the and levels. A. 50. move back below the latter might lead to weakness in the 0. Apr-17 May-17 Jun-17 Jul-17 Sep-17 Oct-17 stock. Deyaar Development After trading firmer for two successive sessions, the stock SMAVG (20) on Close SMAVG (100) on Close O: H: L: C: recorded modest losses in the previous session and closed at Although the daily MACD is heading higher, the RSI and stochastic are trading with a downside bias, hinting at possible negative momentum in the coming session. Key near-term support is positioned at the level, followed by the and levels.
10 A move back below the latter might lead to further downside momentum 100. in the stock. 50. However, the weekly RSI and stochastic indicators are Relative Strength Index (RSI)(14). 0 trading with a positive showing, indicating that the downside might remain limited. The key technical obstacle is placed at %K(9) %D(5). 100. the level, followed by the 100day SMA (currently 50. trading at ) and levels. A sustained break 0. Apr-17 May-17 Jun-17 Jul-17 Sep-17 Oct-17. above the latter might lead to positivity in the stock. Aldar Properties The stock advanced for the second straight session yesterday SMAVG (20) on Close SMAVG (100) on Close O: H: L: C: to finish above the daily upper Bollinger band (currently trading at ) at As of now, the daily MACD and RSI are heading north, accompanied by the stochastic oscillator trading above its overbought region, reflects a bright technical picture.

