Transcription of Death Rates Due to Suicide and Homicide Among Persons …
1 NCHS Data Brief No. 352 October DEPARTMENT OF HEALTH AND HUMAN SERVICESC enters for Disease Control and PreventionNational Center for Health StatisticsDeath Rates Due to Suicide and Homicide Among Persons Aged 10 24: United States, 2000 2017 Sally C. Curtin, , and Melonie Heron, findingsData from the National Vital Statistics System After stable trends from 2000 to 2007 , Suicide Rates for Persons aged 10 24 increased from 2007 ( per 100,000 Persons ) to 2017 ( ), while Homicide Rates declined from 2007 to 2014 and then increased through 2017. The Suicide rate for Persons aged 10 14 declined from 2000 ( ) to 2007 ( ), and then nearly tripled from 2007 to 2017 ( ), while the Homicide rate declined 18% from 2000 ( ) to 2017 ( ). For Persons aged 15 19 and 20 24, Suicide and Homicide Death Rates both increased more recently during the 2000 2017 period, with the increase in Suicide Rates beginning earlier than for Homicide Rates .
2 For the total age group 10 24 and for Persons aged 15 19 and 20 24, Suicide Rates surpassed Homicide Rates during the latter part of the 2000 2017 due to Suicide and Homicide , often referred to collectively as violent deaths, have consistently been a major cause of premature Death to Persons aged 10 24 in the United States (1 3). In 2017, Suicide was the second leading cause of Death for Persons aged 10 14, 15 19, and 20 24, and Homicide ranked third for Persons aged 15 19 and 20 24 and fifth for Persons aged 10 14 (4). This report presents trends for 2000 2017 in Suicide and Homicide Death Rates for all Persons aged 10 24 and for age groups 10 14, 15 19, and 20 24. After a stable period from 2000 to 2007 , Suicide Rates for Persons aged 10 24 increased from 2007 to 2017, while Homicide Rates increased from 2014 to 2017. The Suicide rate Among Persons aged 10 24 was stable from 2000 to 2007 , and then increased 56% between 2007 ( per 100,000) and Figure 1.
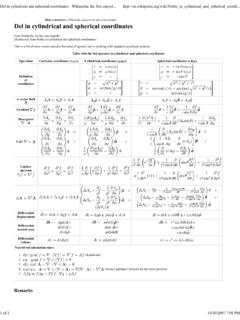
3 Suicide and Homicide Death Rates Among Persons aged 10 24: United States, 2000 20171 Stable trend from 2000 to 2007 ; significant decreasing trend from 2007 to 2014; significant increasing trend from 2014 to 2017, p < 2 Stable trend from 2000 to 2007 ; significant increasing trend from 2007 to 2017 with different Rates of change over time, p < significantly lower than the rate for Homicide from 2000 to 2009 and significantly higher from 2011 to 2017, p < : Suicide deaths are identified with International Classification of Diseases, 10th Revision (ICD 10) codes U03, X60 X84, and ; and Homicide deaths with ICD 10 codes U01 U02, X85 Y09, and Access data table for Figure 1 at: # : NCHS, National Vital Statistics System, per 100,000 Persons aged 10 2412108642020002002200420062008201020122 01420162017 Suicide2,3 Homicide1 NCHS reports can be downloaded from: Data Brief No. 352 October 2019 2 2017 ( ) (Figure 1).
4 The pace of increase for Suicide was greater from 2013 to 2017 (7% annually, on average) than from 2007 to 2013 (3% annually). After a stable period from 2000 to 2007 , the Homicide rate Among Persons aged 10 24 declined 23% from 2007 ( ) to 2014 ( ), and then increased 18% through 2017 ( ). In 2000, the Homicide rate for Persons aged 10 24 ( ) was higher than the Suicide rate ( ) and remained higher through 2009. From 2011 to 2017, the Suicide rate was higher than the Homicide rate ( and , respectively, in 2017).For Persons aged 10 14, Suicide Rates increased from 2007 to 2017, while Homicide Rates declined. The Suicide rate for Persons aged 10 14 declined from 2000 ( ) to 2007 ( ), and then nearly tripled from 2007 to 2017 ( ) (Figure 2). Homicide Rates for Persons aged 10 14 declined 18% from 2000 ( ) to 2017 ( ). The Suicide rate for Persons aged 10 14 was higher than the Homicide rate from 2000 to 2005, not significantly different from 2006 to 2008, and higher again from 2009 to 2017.
5 By 2017, the Suicide rate was more than twice the Homicide rate ( compared with ). Figure 2. Suicide and Homicide Death Rates Among children and adolescents aged 10 14: United States, 2000 20171 Significant decreasing trend from 2000 to 2007 ; significant increasing trend from 2007 to 2017, p < significantly higher than the rate for Homicide from 2000 to 2005 and from 2009 to 2017, p < decreasing trend from 2000 to 2017, p < NOTES: Suicide deaths are identified with International Classification of Diseases, 10th Revision (ICD 10) codes U03, X60 X84, and ; and Homicide deaths with ICD 10 codes U01 U02, X85 Y09, and Access data table for Figure 2 at: # : NCHS, National Vital Statistics System, per 100,000 Persons aged 10 1432102000200220042006200820102012201420 162017 Suicide1,2 Homicide3 NCHS Data Brief No. 352 October 2019 3 Suicide and Homicide Death Rates for Persons aged 15 19 have increased recently during 2000 2017, from 2007 to 2017 for Suicide and from 2014 to 2017 for Homicide .
6 The Suicide rate for Persons aged 15 19 was stable from 2000 to 2007 , and then increased 76% from 2007 ( ) to 2017 ( ) (Figure 3). The pace of increase was greater from 2014 to 2017 (10% annually, on average) than from 2007 to 2014 (3% annually). Homicide Rates for Persons aged 15 19 increased from 2000 to 2007 , declined from 2007 to 2014, and then increased 30% from 2014 ( ) to 2017 ( ). In 2000, the Homicide rate for Persons aged 15 19 ( ) was higher than the Suicide rate ( ) and remained higher through 2010. From 2011 to 2017, the Suicide rate was higher than the Homicide rate ( and , respectively, in 2017).Figure 3. Suicide and Homicide Death Rates Among adolescents aged 15 19: United States, 2000 20171 Significant increasing trend from 2000 to 2007 ; significant decreasing trend from 2007 to 2014; significant increasing trend from 2014 to 2017, p < 2 Stable trend from 2000 to 2007 ; significant increasing trend from 2007 to 2017 with different Rates of change over time, p < significantly lower than the rate for Homicide from 2000 to 2010 and significantly higher from 2011 to 2017, p < : Suicide deaths are identified with International Classification of Diseases, 10th Revision (ICD 10) codes U03, X60 X84, and ; and Homicide deaths with ICD 10 codes U01 U02, X85 Y09, and Access data table for Figure 3 at: # : NCHS, National Vital Statistics System, per 100,000 Persons aged 15 1968101242020002002200420062008201020122 01420162017 Suicide2,3 Homicide1 NCHS Data Brief No.
7 352 October 2019 4 Suicide Death Rates for Persons aged 20 24 increased from 2000 to 2017, and Homicide Rates increased from 2014 to 2017. The Suicide rate increased 36% from 2000 ( ) to 2017 ( ), with a greater pace of increase from 2013 to 2017 (6% annually, on average) than from 2000 to 2013 (1% annually) (Figure 4). The Homicide rate declined 24% from 2000 ( ) to 2014 ( ), and then increased 15% through 2017 ( ). In 2000, the Homicide rate for Persons aged 20 24 ( ) was 28% higher than the Suicide rate ( ); the Rates converged in 2010, were essentially the same from 2010 to 2012, and then the Suicide rate was higher than the Homicide rate from 2013 to 2017 ( and , respectively, in 2017).Figure 4. Suicide and Homicide Death Rates Among young adults aged 20 24: United States, 2000 20171 Significant decreasing trend from 2000 to 2014; significant increasing trend from 2014 to 2017, p < 2 Significant increasing trend from 2000 to 2017 with different Rates of change over time, p < significantly lower than the rate for Homicide from 2000 to 2009 and significantly higher from 2013 to 2017, p < : Suicide deaths are identified with International Classification of Diseases, 10th Revision (ICD 10) codes U03, X60 X84, and ; and Homicide deaths with ICD 10 codes U01 U02, X85 Y09, and Access data table for Figure 4 at: # : NCHS, National Vital Statistics System, per 100,000 Persons aged 20 2415102050200020022004200620082010201220 1420162017 Suicide2,3 Homicide1 NCHS Data Brief No.
8 352 October 2019 5 SummaryIn 2017, Suicide and Homicide were the second and third leading causes of Death for Persons aged 15 19 and 20 24 and ranked second and fifth Among Persons aged 10 14 (4). After a stable period from 2000 to 2007 , Suicide and Homicide Death Rates for Persons aged 10 24 increased recently during the time period, since 2007 for Suicide , and since 2014 for Homicide . For Persons aged 10 14, Suicide Rates began increasing in 2010, whereas the Homicide rate declined during the 2000 2017 period. In contrast, recent increases were observed for both Suicide and Homicide Death Rates Among Persons aged 15 19 and 20 24, with the increases for Suicide Rates beginning earlier than for Homicide Rates . In addition, for Persons aged 15 19 and 20 24, Suicide Rates surpassed Homicide Rates during the latter part of the Data Brief No. 352 October 2019 6 Data sources and methodsMortality and population data are from the National Center for Health Statistics 2000 2017 multiple cause-of- Death mortality files (5).
9 These data are compiled from data provided by the 57 vital statistics jurisdictions through the Vital Statistics Cooperative Program. Population data for 2000 and 2010 are April 1 bridged-race census counts, for 2001 2009 they are July 1 intercensal estimates, and for 2011 2017 they are July 1 postcensal estimates based on the 2010 census. Deaths to Persons aged 10 24 that were assigned an International Classification of Diseases, 10th Revision underlying cause-of- Death code for Homicide (U01 U02, X85 Y09, and ) and Suicide (U03, X60 X84, and ) (6) were selected. Numbers of deaths for Suicide and Homicide for the age groups 10 14, 15 19, and 20 24 are shown in corresponding data tables for each figure. Figures 1 4 were evaluated using the Joinpoint Regression Program (7). The Joinpoint software was used to fit weighted least-squares regression models to the estimated proportions on the logarithmic scale.
10 The default settings allowed for as few as three observed time points in the beginning, ending, and middle line segments, including the joinpoints. Using these settings, a maximum of two joinpoints were searched for using the grid search algorithm and permutation test and an overall alpha level of comparisons between Suicide and Homicide Rates were tested using the z test statistic at the level of Data Brief No. 352 October 2019 7 About the authorsSally C. Curtin and Melonie Heron are with the National Center for Health Statistics, Division of Vital Johnston BD, Ebel BE. Child injury control: Trends, themes, and controversies. Acad Pediatr 13(6):499 507. David-Ferdon C, Simon TR. Preventing youth violence: Opportunities for action. National Center for Injury Prevention and Control. 2014. Available from: Sumner SA, Mercy JA, Dahlberg LL, Hillis SD, Klevens J, Houry D. Violence in the United States: Status, challenges, and opportunities.