Transcription of Defence Expenditure of NATO Countries (2010-2017)
1 29 June/juin 2017 COMMUNIQUE PR/CP(2017)111 North Atlantic Treaty Organisation Organisation du Trait de l Atlantique Nord Press & Media Presse & M dias B-1110 Bruxelles Belgique E-mail: Tel.: 32 2 707 50 41 Fax: 32 2 707 13 99 Internet: News and information is routinely placed on the nato website. This includes audio files, transcripts and high resolution photographs, which are posted as soon as possible after events of media interest. Check the 'What's New' file. Nouvelles et informations sont r guli rement affich es sur le site Web de l'OTAN, sous la forme de fichiers audio, de transcriptions et de photographies destin es la publication. Elles sont disponibles le plus rapidement possible apr s les v nements pr sentant un int r t pour les m dias. Cliquer sur "Quoi de neuf?
2 " Defence Expenditure of nato Countries (2010-2017) nato collects Defence Expenditure data from Allies on a regular basis and presents aggregates and subsets of this information. Each Ally s Ministry of Defence reports current and estimated future Defence Expenditure according to an agreed definition of Defence Expenditure . The amounts represent payments by a national government actually made, or to be made, during the course of the fiscal year to meet the needs of its armed forces, those of Allies or of the Alliance. nato also makes use of up-to-date economic and demographic information available from the Directorate-General for Economic and Financial Affairs of the European Commission (DG-ECFIN), and the Organisation for Economic Co-operation and Development (OECD). In view of differences between the definition of nato Defence Expenditure and national definitions, the figures shown in this report may diverge considerably from those which are quoted by media, published by national authorities or given in national budgets.
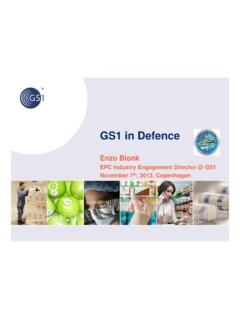
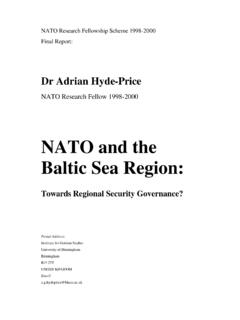
3 Equipment Expenditure includes Expenditure on major equipment as well as on research and development devoted to major equipment. Personnel Expenditure includes pensions paid to retirees. The cut-off date for information used in this report was 26 June 2017. Figures for 2017 are estimates. Cumulative spending increase for the period from 2015 to 2017, above 2014 level: + Bn USDN otes: Figures for 2017 are estimates. The nato Europe and Canada aggregate from 2017 includes Montenegro, which became an Ally on 5 June 2017.* Defence Expenditure does not include pensions. -2-Graph 1 : nato Europe and Canada - Defence Expenditure (annual real change, based on 2010 prices and exchange rates)Graph 2 : Defence Expenditure as a share of GDP versus equipment Expenditure as a share of Defence Expenditure 2017e** In December 2016, Turkey fundamentally changed the calculation methodology of GDP (to bring it in line with the European System of Accounts (ESA) 2010), resulting in significant increases from 2011.
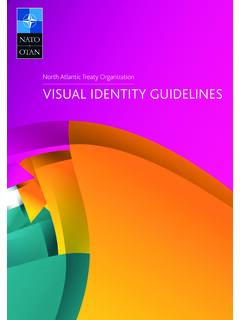
4 If one uses the previous methodology, then the corresponding percentage for 2017 is *CANHRVCZEDNKESTFRADEUGRCHUNITALVALTULUX MNENLDNORPOLPRTROUSVKSVNESPTUR** Expenditure as % of Defence expenditureDefence Expenditure as % of GDP%% nato guideline 2% nato guideline 20%Median : Figures for 2017 are estimates.* Defence Expenditure does not include pensions. -3-Graph 3 : Defence Expenditure as a share of GDP (%)(based on 2010 prices and exchange rates)Graph 4 : Equipment Expenditure as a share of Defence Expenditure (%)(based on 2010 prices and exchange rates)** In December 2016, Turkey fundamentally changed the calculation methodology of GDP (to bring it in line with the European System of Accounts (ESA) 2010), resulting in significant increases from 2011. If one uses the previous methodology, then the corresponding percentages for 2014 and 2017 are and , respectively.
5 Guideline 2% guideline 20%Notes: Includes enlargements which took place in: 1999 (3 Allies), 2004 (7 Allies), 2009 (2 Allies) and 2017 (1 Ally). Figures for 2017 are 5 : Defence Expenditure as a share of GDP (%)(based on 2010 prices and exchange rates)Graph 6 : nato Europe and Canada - Defence Expenditure (billion US dollars, based on 2010 prices and exchange rates) 0123456719891990199119921993199419951996 1997199819992000200120022003200420052006 2007200820092010201120122013201420152016 2017e%United StatesNATO TotalNATO Europe and CanadaNATO guideline 2%20022525027530032535019891990199119921 9931994199519961997199819992000200120022 0032004200520062007200820092010201120122 0132014201520162017e+ CZE, HUN, POL+ BGR, EST, LVA, LTU, ROU, SVK, SVN+ ALB, HRV+ MNENATO Europe and CanadaNotes: Figures for 2017 are estimates.
6 The nato Europe and Canada aggregate from 2017 includes Montenegro, which became an Ally on 5 June 7 : Defence Expenditure (billion US dollars, based on 2010 prices and exchange rates)Graph 8 : Defence Expenditure as a share of GDP (%)(based on 2010 prices and exchange rates)7207266866456115946086162932862792 752722772862991,0141,0129659208838718959 1502004006008001,0001,200201020112012201 32014201520162017eUnited StatesNATO Europe and StatesNATO Europe and CanadaTable 1 : Defence expenditureNational currency units, million20102011201220132014201520162017e Current pricesAlbania (Leks)19,32119,87719,82019,02218,78816,6 7116,25019,352 Belgium (Euros)3,9603,9564,0233,9643,9133,7893,9 013,965 Bulgaria* (Leva)1,2301,0661,0991,1961,1021,1161,18 61,508 Canada (Canadian dollars)19,25521,80819,97818,76420,07623 ,91924,08527,607 Croatia (Kunas)5,0575,3235,0594,8484,6254,5864,2 414,553 Czech Republic (Koruny)50,80843,13142,78042,03541,00347 ,26445,59852,465 Denmark (Kroner)25,32824,25925,61823,68222,76922 ,63324,19025,165 Estonia (Euros)251280340361386418450478 France (Euros)39,24138,44339,10539,40239,14939, 19939,95040,852 Germany (Euros)34,92534,63036,16834,59334,74935, 89837,59839,509 Greece (Euros)5,9664,9344,3843,9993,9394,0734,1 904,213 Hungary (Forint)
7 280,895295,967297,650286,341281,402316,3 38362,798389,483 Italy (Euros)21,63721,74120,60020,07818,42717, 64220,22620,787 Latvia (Euros)189206193212221254360448 Lithuania (Euros)246248252267322425575724 Luxembourg (Euros)187167167176190225213256 Montenegro (Euros)5657534952515666 Netherlands (Euros)8,4728,1568,0677,7027,7887,8168,2 348,686 Norway (Kroner)39,27940,53441,56043,51846,23446 ,90050,93754,306 Poland (Zlotys)25,60826,97928,36528,46731,87439 ,94037,08239,193 Portugal (Euros)2,6732,6272,3662,4572,2632,3842,3 642,512 Romania (New Lei)6,6307,2557,2828,1609,01410,33710,73 816,322 Slovak Republic (Euros)8597667947297528899071,004 Slovenia (Euros)583479423382366361406426 Spain (Euros)11,13210,05910,8289,4959,50810,00 09,01410,739 Turkey (Liras)21,24122,80724,95627,46629,72732, 52238,14144,240 United Kingdom (Pounds)39,05339,20436,56339,82439,90238 ,94042,18943,002 United States (US dollars)720,423740,744712,947680,856653, 942641,253664,058683,414 Constant 2010 prices Albania (Leks)19,32119,42719,17218,34717,86515,8 0615,44617,874 Belgium (Euros)3,9603,8783,8643,7643,6913,5433,5 923,575 Bulgaria* (Leva)1,2301,0061,0211,1191,0261,0171,06 91,346 Canada (Canadian dollars)19,25521,12319,11717,67618,55922 ,28622,30625,041 Croatia (Kunas)5,0575,2354,8984,6574,4404,3994,0 734,313 Czech Republic (Koruny)50,80843,12242,15640,83738,87044 ,36142,34448,035 Denmark (Kroner)25,32823,60424,34022,31421,33921 ,11522,52223,140 Estonia (Euros)251266313320337360381390 France (Euros)39,24138,08438,29738,29037,82537, 46538,03638,558 Germany (Euros)
8 34,92534,26335,24233,05832,60933,03734,1 0935,515 Greece (Euros)5,9664,8944,3654,0784,0924,2764,3 954,319 Hungary (Forint)280,895289,566281,604263,171250, 222276,498314,010331,325 Italy (Euros)21,63720,94919,52118,52616,70915, 73517,61017,906 Latvia (Euros)189194175189195222313383 Lithuania (Euros)246235233244291383512627 Luxembourg (Euros)187159155161172202192227 Montenegro (Euros)5657524850485260 Netherlands (Euros)8,4728,0577,8277,3597,3747,3937,7 218,011 Norway (Kroner)39,27939,46539,62240,24441,98541 ,29944,00645,790 Poland (Zlotys)25,60826,13526,84726,86529,93337 ,22634,49435,938 Portugal (Euros)2,6732,6342,3822,4182,2112,2822,2 272,340 Romania (New Lei)6,6306,9276,6417,1967,8188,7558,9021 3,329 Slovak Republic (Euros)859754771705728863884969 Slovenia (Euros)583474417373355347388402 Spain (Euros)11,13210,05610,8179,4529,4909,931 8,92510,483 Turkey (Liras)21,24121,01221,39522,24622,37122, 66224,72026,368 United Kingdom (Pounds)39,05338,43135,29937,72937,19136 ,09638,44038,334 United States (US dollars)720,423725,768686,226644,803611, 159593,577608,377616,029* Data do not include 2.
9 Defence expenditureMillion US dollars20102011201220132014201520162017e Current prices and exchange ratesNATO Europe274,592281,683263,654269,441270,20 2235,121237,883 | 242,234 Albania186197183180178132131152 Belgium5,2455,5005,1695,2645,1924,2024,3 154,303 Bulgaria *832758722811747633671821 Croatia920996865850805669623651 Czech Republic2,6602,4372,1852,1481,9751,9211, 8662,119 Denmark4,5044,5184,4234,2164,0563,3643,5 933,667 Estonia332389437480513463497519 France51,97153,44150,24552,31651,94043,4 7444,19144,333 Germany46,25548,14046,47045,93246,10239, 81341,59042,875 Greece7,9026,8585,6335,3105,2264,5174,63 54,572 Hungary1,3511,4721,3221,2801,2101,1321,2 891,355 Italy28,65630,22326,46826,65824,44819,56 622,37322,558 Latvia251286248281293281398487 Lithuania326344324355427471636785 Luxembourg248232214234253249236278 Montenegro7480686569576272 Netherlands11,22011,33910,36510,22610,33 28,6689,1089,426 Norway6,4997,2327,1437,4077,3365,8166,06 46,309 Poland8,4939,1068,7109,00710,10410,5969, 4059,997 Portugal3,5403,6523,0403,2623,0032,6442, 6152,726 Romania2,0862,3802,1002,4522,6922,5812,6 333,844 Slovak Republic1,1381,0651,0209689979861,0031,0 90 Slovenia772666543507486401449462 Spain14,74313,98413,91212,60712,61411,09 09,97111,655 Turkey14,13413,61613,89514,42713,58311,9 5712,62912,315 United Kingdom60,32962,85258,01662,26365,69059, 49256,96454,863 North America739,113762,784732,941699,077672,0 92659,953682,230703,729 Canada18,69022,04019,99418,22118,15018,7 0018,17220,315 United States720,423740,744712,947680,856653,94 2641.
10 253664,058683,414 nato Total1,013,705 1,044,467996,595968,518942,294895,074920 ,114 | 945,962 Constant 2010 prices and exchange ratesNATO Europe274,592265,810260,703257,595254,11 5255,507264,680 | 274,458 Albania186187184177172152149172 Belgium5,2455,1375,1184,9854,8894,6934,7 574,735 Bulgaria *832681691757695689723911 Croatia920952891847808800741785 Czech Republic2,6602,2582,2072,1382,0352,3232, 2172,515 Denmark4,5044,1974,3283,9683,7943,7544,0 054,115 Estonia332352415424446477505516 France51,97150,43950,72150,71150,09649,6 1950,37651,067 Germany46,25545,37846,67543,78343,18843, 75545,17547,036 Greece7,9026,4825,7825,4015,4205,6645,82 15,720 Hungary1,3511,3931,3541,2661,2031,3301,5 101,593 Italy28,65627,74625,85324,53622,13020,84 023,32323,715 Latvia251256232251258295415507 Lithuania326312309323385507678830 Luxembourg248211206214227267255301 Montenegro7475696366646980 Netherlands11,22010,67010,3679,7479,7669 ,79110,22510,610 Norway6,4996,5306,5566,6596,9476,8337,28 17,576 Poland8,4938,6678,9048,9109,92712,34611, 44011,919 Portugal3,5403,4893,1553,2032,9293,0222, 9493,099 Romania2,0862,1802,0902,2642,4602,7552,8 014,194 Slovak Republic1,1389991,0229349641,1431,1701,2 83 Slovenia772627552494471460514533 Spain14,74313,31914,32712,51912,56913,15 311,82013,884 Turkey14,13413,98214,23714,80314,88615,0 8016,44917,546 United Kingdom60,32959,36854,53058,28357,45155, 76059,38159,218 North America739,113746,272704,783661,961629,1 75615,210630,029640,336 Canada18,69020,50418,55717,15818,01521,6 3321,65224,307 United States720,423725,768686,226644,803611,15 9593.