Transcription of Defence Expenditure of NATO Countries (2013 2019
1 29 November/Novembre 2019 COMMUNIQUE PR/CP(2019)123 North Atlantic Treaty Organisation Organisation du Trait de l Atlantique Nord Press & Media Presse & M dias B-1110 Bruxelles Belgique E-mail: Tel.: 32 2 707 50 41 Fax: 32 2 707 13 99 Internet: News and information is routinely placed on the nato website. This includes audio files, transcripts and high resolution photographs, which are posted as soon as possible after events of media interest. Check the 'What's New' file. Nouvelles et informations sont r guli rement affich es sur le site Web de l'OTAN, sous la forme de fichiers audio, de transcriptions et de photographies destin es la publication.
2 Elles sont disponibles le plus rapidement possible apr s les v nements pr sentant un int r t pour les m dias. Cliquer sur "Quoi de neuf?" Defence Expenditure of nato Countries (2013-2019) nato collects Defence Expenditure data from Allies on a regular basis and presents aggregates and subsets of this information. Each Ally s Ministry of Defence reports current and estimated future Defence Expenditure according to an agreed definition of Defence Expenditure . The amounts represent payments by a national government actually made, or to be made, during the course of the fiscal year to meet the needs of its armed forces, those of Allies or of the Alliance.
3 In the figures and tables that follow, nato also uses economic and demographic information available from the Directorate-General for Economic and Financial Affairs of the European Commission (DG-ECFIN), and the Organisation for Economic Co-operation and Development (OECD). In view of differences between both these sources and national GDP forecasts, and also the definition of nato Defence Expenditure and national definitions, the figures shown in this report may diverge considerably from those which are quoted by media, published by national authorities or given in national budgets. Equipment Expenditure includes Expenditure on major equipment as well as on research and development devoted to major equipment.
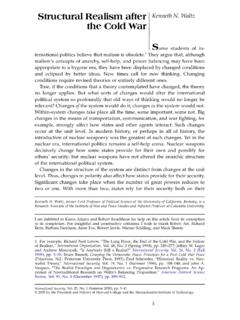
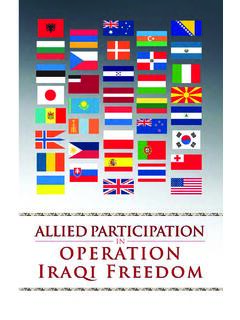
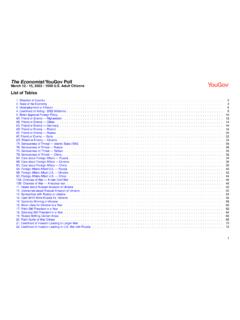
4 Personnel Expenditure includes pensions paid to retirees. The cut-off date for information used in this report was 21 November 2019. Figures for 2019 are estimates. -2- Graph 1 : nato Europe and Canada - Defence Expenditure (annual real change, based on 2015 prices and exchange rates)Notes: Figures for 2019 are estimates. The nato Europe and Canada aggregate from 2017 onwards includes Montenegro, which became an Ally on 5 June 2 : Defence Expenditure as a share of GDP and equipment Expenditure as a share of Defence Expenditure 2019eNotes: Figures for 2019 are estimates. Expenditure as % of Defence expenditureDefence Expenditure as % of GDP%% nato guideline 2% nato guideline 20%Median Notes: Figures for 2019 are 3 : Defence Expenditure as a share of GDP (%)(based on 2015 prices and exchange rates)Notes: Figures for 2019 are 4 : Equipment Expenditure as a share of Defence Expenditure (%)(based on 2015 prices and exchange rates) guideline 2% guideline 20%-4- Graph 5 : Defence Expenditure (billion US dollars, based on 2015 prices and exchange rates)Notes: Figures for 2019 are estimates.
5 The nato Europe and Canada aggregate from 2017 onwards includes Montenegro, which became an Ally on 5 June ,0001,2002013201420152016201720182019eUn ited StatesNATO Europe and Canada(billion US dollars, based on 2015 prices and exchange rates)Notes: Figures for 2019 are estimates. Includes enlargements which took place in: 1999 (3 Allies), 2004 (7 Allies), 2009 (2 Allies) and 2017 (1 Ally).Graph 6 : nato Europe and Canada - Defence expenditure20022525027530032535019891990 1991199219931994199519961997199819992000 2001200220032004200520062007200820092010 201120122013201420152016201720182019e+ CZE, HUN, POL+ BGR, EST, LVA, LTU, ROU, SVK, SVN+ ALB, HRV+ MNE+ CZE, HUN, POL+ BGR, EST, LVA, LTU, ROU, SVK, SVN+ ALB, HRV+ MNENATO Europe and Canada-5- Figures from 2019 - 2024 are estimates.
6 Graph 7 : nato Europe and Canada - cumulative Defence spending over 2016(billion US dollars, based on 2015 prices and exchange rates)4313024640005010015020025030035040 04502018202020222024 Graph 8 : nato Europe and Canada - major equipment Expenditure (annual real change, based on 2015 prices and exchange rates)Notes: Figures for 2019 are estimates. The nato Europe and Canada aggregate from 2017 onwards includes Montenegro, which became an Ally on 5 June 1 : Defence expenditureMillion national currency units2013201420152016201720182019eCurren t pricesAlbania (Leks)19,02218,78816,67116,25017,19918,9 9521,702 Belgium (Euros)3,9643,9133,7893,8483,9324,1014,3 03 Bulgaria (Leva)1,1961,1021,1161,1861,2551,5933,71 6 Canada (Canadian dollars)18,76420,07623,90023,47430,76129 ,02529,600 Croatia (Kunas)4,8486,1136,0575,6966,1206,0686,6 83 Czech Republic (Koruny)42,03541,00347,26445,59852,80559 ,75266,737 Denmark (Kroner)23,68222,76922,63324,19024,96128 ,78730,389 Estonia (Euros)361386418450479514586 France (Euros)39,40239,14939,19939,95040,85242, 74844,361 Germany (Euros)
7 34,59334,74935,89837,59840,26542,12747,8 78 Greece (Euros)3,9993,9394,0734,1904,2084,5604,3 20 Hungary (Forint)286,341281,402316,338362,798402, 793484,031553,383 Italy (Euros)20,07818,42717,64220,22621,16621, 18321,408 Latvia* (Euros)212221254364430613634 Lithuania* (Euros)267322425575724895968 Luxembourg (Euros)176190225213288301346 Montenegro (Euros)49525156586481 Netherlands (Euros)7,7027,7887,8168,2348,5399,45610, 912 Norway (Kroner)46,05748,66049,52954,02256,66461 ,34966,127 Poland* (Zlotys)28,46731,87439,94037,08237,55842 ,82445,118 Portugal (Euros)2,4572,2632,3842,3642,4242,8743,1 60 Romania* (New Lei)8,1609,01410,33710,73814,76517,18120 ,932 Slovak Republic (Euros)7297528899079351,0981,666 Slovenia (Euros)382366361406422463508 Spain (Euros)9,4959,50810,0009,01410,52811,172 11,505 Turkey (Liras)27,46629,72732,52238,20347,32368, 30079,356 United Kingdom (Pounds)39,82439,90238,94041,59043,25745 ,20646,861 United States (US dollars)680,856653,942641,253656,059642, 936672,255730,149 Constant 2015 prices Albania (Leks)19,42618,89416,67116,35417,05718,7 0020,921 Belgium (Euros)4,0323,9523,7893,7803,7993,9184,0 52 Bulgaria (Leva)1,2281,1261,1161,1601,1871,4543,30 3 Canada (Canadian dollars)
8 18,95619,89423,90023,29229,76927,62327,9 62 Croatia (Kunas)4,8506,1156,0575,7006,0585,9036,4 06 Czech Republic (Koruny)43,58041,48147,26445,02951,40856 ,95461,781 Denmark (Kroner)24,03022,86822,63324,01724,43828 ,06529,152 Estonia (Euros)376390418443454466513 France (Euros)40,08139,59539,19939,87340,50641, 99343,074 Germany (Euros)35,89835,43935,89837,09239,12140, 18444,823 Greece (Euros)3,9083,9254,0734,1954,1924,5224,2 59 Hungary (Forint)302,053286,921316,338359,267385, 004442,784485,889 Italy (Euros)20,77118,73417,64219,76920,55320, 79120,992 Latvia* (Euros)216221254361413565561 Lithuania* (Euros)271323425567685819863 Luxembourg (Euros)180190225211280281314 Montenegro (Euros)51535154535871 Netherlands (Euros)7,7807,7967,8168,1628,3409,04110, 292 Norway (Kroner)44,90547,28749,52954,64355,17656 ,58859,853 Poland* (Zlotys)28,82932,11939,94036,96736,72341 ,35342,635 Portugal (Euros)2,5252,3092,3842,3232,3472,7432,9 82 Romania* (New Lei)8,5199,24910,33710,48113,77015,13417 ,522 Slovak Republic (Euros)7277508899119281,0681,581 Slovenia (Euros)389370361403413442474 Spain (Euros)9,5259,55710,0008,98810,36910,896 11,123 Turkey (Liras)31,81432,05432,52235,34139,49549, 07448,959 United Kingdom (Pounds)
9 40,68240,07638,94040,75041,47042,53143,1 64 United States (US dollars)696,291660,062641,253651,201626, 380642,012685,099-6-Notes: Figures for 2019 are estimates. * These Allies have national laws and political agreements which call for 2% of GDP to be spent on Defence annually, consequently estimates are expected to change accordingly. For the past years, Allies' Defence spending was based on the then available GDP data and Allies may, therefore, have met the 2% guideline when using those figures (In 2018, Lithuania met 2% using November 2018 OECD figures).Table 2 : Defence expenditureMillion US dollars2013201420152016201720182019eCurr ent prices and exchange ratesAlbania180178132131144176198 Belgium5,2645,1924,2024,2564,4314,8404,9 21 Bulgaria8117476336717239612,179 Canada18,22118,15018,68517,71123,70422,4 0022,485 Croatia8501,0648838379249661,032 Czech Republic2,1481,9751,9211,8662,2592,7502, 967 Denmark4,2174,0573,3643,5933,7804,5594,6 51 Estonia480513463497540607670 France52,31651,94043,47444,19146,03650,4 5950,729 Germany45,93146,10239,81341,59045,37449, 72554,751 Greece5,3095,2264,5174,6354,7425,3834,94 0 Hungary1,2801,2101,1321,2891,4681,7912,0 80 Italy26,65824,44819,56622,37323,85225,00 424.
10 482 Latvia*281293281403484724724 Lithuania*3554274716368161,0561,107 Luxembourg234253249236325355395 Montenegro65695762657692 Netherlands10,22610,3328,6689,1089,62211 ,16212,478 Norway7,8397,7226,1426,4316,8507,5447,70 8 Poland*9,00710,10410,5969,4059,93811,857 11,902 Portugal3,2623,0032,6442,6152,7323,3923, 613 Romania*2,4522,6912,5812,6453,6434,3595, 050 Slovak Republic9689979861,0031,0531,2971,905 Slovenia507486401449476546581 Spain12,60712,61411,0909,97111,86413,187 13,156 Turkey14,42713,58311,95712,64912,97214,1 4513,919 United Kingdom62,25865,65859,49256,15455,67260, 30860,761 United States680,856653,942641,253656,059642,93 6672,255730,149 nato Europe and Canada288,088288,965254,347255,345274,49 0299,631309,479 nato Total968,944942,907895,600911,404917,426 971,8861,039,628 Constant 2015 prices and exchange ratesAlbania154150132130135148166 Belgium4,4724,3834,2024,1924,2144,3454,4 94 Bulgaria6966386336576738241,872 Canada14,82015,55318,68518,21023,27321,5 9621,860 Croatia707892883831883861934 Czech Republic1.