Transcription of Department of Agricultural Economics
1 Department of Agricultural Economics The History and Class pricing of Federal milk Marketing Orders Agricultural Economics Extension Series Number: 2017-13. Owen Townsend, Kenneth Burdine, and Tyler Mark September 2017. The regulation of milk is an important part of the development of the milk industry and an understanding of the history of milk regulation is critical to understanding the pros and cons of the current industry. Additionally, to understand milk pricing it is important to understand the history of the federal milk marketing orders. This publication will provide information on how milk became regulated and how the class pricing system works. A. glossary is provided at the end for reference. Background In 1933, the Agricultural Adjustment Act gave the federal government the authority to regulate the handling of milk .
2 The Agricultural Marketing Agreement of 1937 then gave the Secretary of Agriculture the authority to issue marketing orders, and one of those marketing orders was for milk . The Federal milk Marketing Orders (FMMOs) have evolved considerably since they were authorized in 1937. Initially the marketing orders were designed to coordinate the supply and demand of milk . Since milk is a perishable commodity, regional boundaries were established to help ensure that milk produced could meet demand from local economies. Both technology and transportation have improved over the last 80 years and this has allowed regional boundaries to expand. The milk marketing orders have consolidated to a low of 10 orders, as of 2016, and under these 10 milk marketing orders roughly 60 percent of all milk marketed in the United States is marketed (Federal milk Marketing Orders, Section 10 Review, 2015).
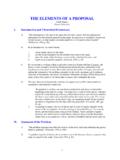
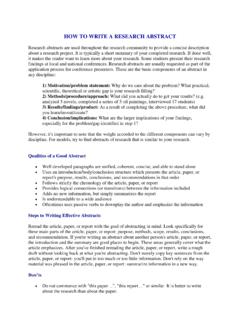
3 Roughly, one-fifth of the remaining 40% of milk marketed comes from california ( california milk Advisory Board, 2016). Figure 1 shows the current regional boundaries of the 10 FMMOs and Table 1 details the names and numbers of each milk marketing order. Figure 1. Map of Federal milk Marketing Orders Federal milk Marketing Orders Order 1 Northeast Order 5 Appalachian Order 6 Florida Order 7 Southeast Order 30 Upper Midwest Order 32 Central Order 33 Mideast Order 124 Pacific Northwest Order 126 Southwest Order 131 Arizona Table 1. List of Federal milk Marketing Orders The current orders were shaped by the 1996 Farm Bill, also known as the Federal Agriculture Improvement and Reform (FAIR) Act of 1996. This bill required the Secretary of Agriculture to reduce the 31 milk marketing orders to between 10 and 14.
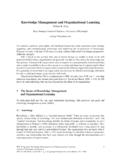
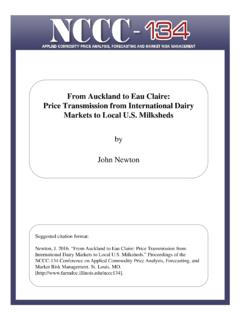
4 The Secretary originally consolidated the orders to 11 under the Consolidated Appropriations Act of 2000. In 2004 the Western FMMO Utah, and parts of Nevada, Idaho, and Oregon was terminated, which is why there are currently only 10 orders. The full federal milk marketing order timeline can be viewed below in Figure 2. Consolidated the number of federal orders from 31 to 11, replaced the basic formula price (BFP) with a new Authorized the Secretary of milk price formula , and created a new Agriculture to issue milk class of milk (Class IV). orders Consolidated Appropriations Act of Agricultural Marketing Act 2000. 1937 2000. 1996. 1933 FAIR Act Agricultural Adjustment Act Instructed the Secretary of Gave federal authority to Agriculture to consolidate regulate the handling of milk the number of milk orders to between 10 and 14.
5 Figure 2. Federal milk Marketing Order Timeline Class pricing Originally, there were only three classes of milk , but after the Consolidated Appropriations Act of 2000 the third class of milk was divided up into Class III and IV. These four classes of milk are: Class I fluid milk Class II Soft manufacturing products (ice cream, cottage cheese, etc.). Class III Hard cheese and cream cheese Class IV Butter and dry milk Each of the four classes of milk has a specific pricing formula that is calculated using a set of component prices (see glossary). Class I and II have advanced pricing and are based on the previous month's end product pricing (McCullock, 2011). Class I. incorporates the higher of the advanced Class III and IV skim milk prices. Advanced prices are based on the first two weeks of the preceding month.
6 The Class II formula uses the advanced Class IV skim milk price. For example, Class III pricing uses the components of other solids, protein, and butterfat, while Class IV uses butterfat and nonfat solids as can be seen below (USDA-AMS, Current Price Formulas). The Class III and IV prices are determined using three steps (Jesse & Cropp, 2008). The first stage of formulating the Class III and IV price involves setting prices for milk components butterfat, protein, nonfat milk solids, and other milk solids by developing product price formulas. Jesse and Cropp (2008) describe the product price formula as: . = .. Breaking that formula up, there are three important parts: product price, make allowance, and yield. The product price is the monthly average of the wholesale prices for each product cheese, dry whey, butter, and nonfat dry milk (Jesse & Cropp, 2008).
7 The cheese component of the product price is specifically the wholesale prices of block and barrel cheddar cheese, and butter is Grade AA butter (Jesse & Crop, 2008). The second part of the product price, the make allowance, is the estimated manufacturing cost per pound and is determined through a survey of processors' costs. The current make allowance for butter, for example, is $ (Class III butterfat price formula below). (Stephenson, 2007), which suggests that it costs roughly 17 cents to make one pound of butter. = ( ) Lastly, the yield factor estimates how much of a product can be produced from one pound of a component. For example, from the Class III butter price formula , the yield factor for butter is This suggests that one pound of butterfat (the component) can yield pounds of butter (the product).
8 After the component prices have been determined, stage one has been completed. In the second stage, the skim milk price is determined using the component prices that were previously discussed. Since a hundredweight of Class IV skim milk has been calculated to contain 9 pounds of nonfat milk solids , the Class IV skim milk price is as follows: = 9. The skim milk prices for Class III and IV are important because they are also part of the Class I and II pricing formulas. Class II uses the advanced Class IV skim milk price to help determine the Class II skim milk price, and Class I uses the higher of the advanced Class III or IV skim milk price as part of the Class I skim milk price. The third and final stage in determining the Class III and IV prices is dependent on butterfat content.
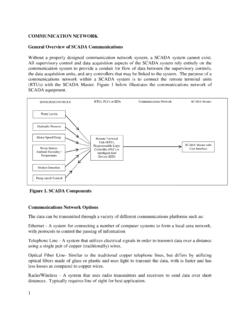
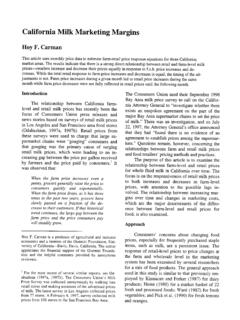
9 The Class III butterfat component price that was derived in the first stage is used with the Class III skim milk price that was discussed in the second stage to come up with the final Class III and IV prices. The Class IV price also uses the Class III. butterfat price to determine its final price. Figure 3 shows applicable pricing formulas for all four classes of milk . : = ( ) + ( ).. = . + .. = . + ( 100). : = ( ) + ( ). = + $ = + $ . = . 9. : = ( ) + ( ). = ( ) + ( ). = (( ) ). + (((( ) ) ) ). = ( ) = ( ) : = ( ) + ( ). = 9. = ( ) = . Figure 3. Current pricing Formulas (USDA-AMS, Current Price Formulas). Class utilization refers to the share of milk that is processed in each class. Regions with a relatively low level of milk production will see a greater share of their milk sold for fluid use and regions with relatively higher milk production will see more of their milk sold into the lower classes.
10 For example, 70% Class 1 utilization would mean that 70% of the milk is processed as Class I, meaning it is processed for fluid consumption. Since the Appalachian, Florida, and Southeast Orders are largely milk -deficit orders, more of the milk produced is processed as Class I for these regions. The Upper Midwest Order, Order 30, has very low Class I utilization compared to the Southern orders, as can be seen in Table 2. 2016 Class I Utilization Appalachian Southeast Florida Upper Midwest Jan Feb Mar Apr May June July Aug Sept Oct Nov Dec Table 2. 2016 Class I Utilization Percentages (USDA-AMS, 2016 Class I Utilization Percentage of Producer milk , 2016). The Upper Midwest Order, for example, has a high Class III utilization given the large number of cheese processing plants located within order.