Transcription of Description of controlled spike-in experiment
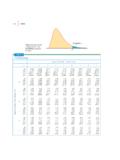
1 Description of controlled spike -in experimentSeptember 19, 20111 Experimental designThe experiment aimed at evaluating the ability of significance analysis to detect known fold changes, as wellas the extent of false positive changes among proteins spiked in constant concentrations. It was conductedin a case-control experimental design with six mixtures that share a same complex background. To evaluatethe sensitivity of detecting known fold changes, six proteins were spiked into the background in varyingconcentrations, according to the Latin Square design1inFigure 1a. The design is advantageous as it allowsus to evaluate the ability to detect a range of fold changes over a series of proteins, baseline concentrations,and runs, while limiting the total number of mixtures. To evaluate the specificity of the models, six additionalproteins were spiked in different but constant concentrations to all the mixtures as inFigure 1b. Eachprotein was represented by 2 peptides, and each peptide was represented by 3 Sample selectionEach spike -in mixture contained three components: (1) 24 crude synthetic unlabeled ( endogenous ) peptides(purchased from JPT technology, Germany), representing twelveS.
2 Cerevisiaeproteins, with 2 peptides perprotein; (2) the isotopically labeled reference peptides with the same sequences of amino acids (purchasedfrom JPT technology, Germany); and (3) a complex peptide background generated from whole worm Sample preparationSix different mixtures were generated from these components for the purposes of relative endogenous peptides from six proteins were mixed at varying concentrations in a Latin Squaredesign (Figure 1a). These peptides serve as positive controls, and represent proteins with true changes inconcentration across mixtures. The second set of twelve endogenous peptides from the remaining six proteinswas mixed at constant concentrations (Figure 1b). These peptides serve as negative controls, and representproteins in constant concentration across maximum concentration of each endogenous peptide in a mixture was 50 fmol. This concentrationgives signal intensities, depending on each individual peptide, in the range of 105to 106counts per remaining concentrations were obtained by a relative fractionation.
3 Among the controls, the relativeconcentrations of each peptide between two mixtures varied from two fold up to a maximum of 512 fold,in order to resemble the natural dynamic range encountered in biological samples, as well as to test thedynamic range of the triple quadrupole mass spectrometry instrument. The reference peptides, labeled witha heavy Arginine (R) or Lysine (K), were further spiked into each sample at constant concentrations, equalto one-tenth of the resulting mixture of synthetic peptides was spiked into a complex and non-fractionated peptidebackground prepared from a wholeC. eleganslysate, which generated from mixed-stage, wild-typeC. elegansworms4, (a) Proteins in varying concentrations(b) Proteins in constant concentrationMixture 1!Mixture 2!Mixture 3!Mixture 4!Mixture 5!Mixture 6!YBR132C!Max!Max/512!Max/256!Max/128!Ma x/32!Max/8!YBR144C!Max/8!Max!Max/512!Max /256!Max/128!Max/32!YBR147W!Max/32!Max/8 !Max !Max/512!Max/256!
4 Max/128!YBR184W!Max/128!Max/32!Max/8!Max !Max/512!Max/256!YBR203W!Max/256!Max/128 !Max/32!Max/8!Max!Max/512!YBR284W!Max/51 2!Max/256!Max/128!Max/32!Max/8!Max!Note: Max is 50 fmol Mixture 1!Mixture 2!Mixture 3!Mixture 4!Mixture 5!Mixture 6!YBR168W!Max!Max!Max!Max!Max!Max!YBR186 W!Max!Max!Max!Max!Max!Max!YBR204C!Max/32 !Max/32!Max/32!Max/32!Max/32!Max/32!YBR2 28W!Max/32!Max/32!Max/32!Max/32!Max/32!M ax/32!YBR250W!Max/256!Max/256!Max/256!Ma x/256!Max/256!Max/256!YBR270C!Max/256!Ma x/256!Max/256!Max/256!Max/256!Max/256!No te: Max is 50 fmol Figure 1: Experimental design of the controlled spike -in experiment . The maximal concentration in eachmixture, denoted Max , was 50 fmol for all proteins.(a)Concentrations of proteins spiked in a LatinSquare design.(b)Concentrations of proteins spiked in constant Mass spectrometric analysisThe targeted mass spectrometry analysis was optimized as in (Picotti et. al., 2010). The order of themixtures was randomized, and each mixture was profiled in two mass spectrometry runs.
5 The procedurewas repeated a second time to acquire a second set of replicate runs. Quantitative measurements wereperformed on 4000 QTRAP instrument in time-scheduled SRM mode using software Analyst (AppliedBiosystems/MDS Sciex), and peptide separation using Tempo Nano LC system (Applied Biosystems/MDSS ciex).5 Signal processingEach transition was quantified by its peak apex automatically, using MultiQuant software package (AppliedBiosystems/MDS Sciex). Due to sample evaporation, the strength of the signal varied between runs in thesecond replicate set. The quantified transitions were manually curated, resulting in the total of 49 transitionsand a small number of missing Montgomery, and analysis of experiments(Wiley, 2005).2. Picotti, generation of selected reaction-monitoring assays for proteins Methods10, 43 46 (2010).3. Gerber, S. A., Rush, J., Stemman, O., Kirschner, M. W. & Gygi, S. P. Absolute quantification of proteinsand phosphoproteins from cell lysates by tandem of the National Academy of Science ofthe USA100, 6940 6945 (2003).
6 4. Jovanovic, quantitative targeted proteomics approach to validate predicted microrna targetsinC. Methods10, 837 842 (2010).5. Schrimpf, S. functional analysis of the caenorhabditis elegans and drosophilamelanogaster Biology7, e48 (2009).2