Transcription of Descriptive Statistics and Psychological Testing
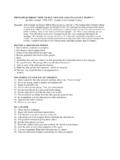
1 Descriptive Statistics and Psychological Testing By Stephen E. Brock, , NCSP California State University, Sacramento ..13% .13% -3sd -2sd -1sd Mean (Median & Mode) +1sd +2sd +3sd Below Average Low Average Average High Average Above Average Z- Score -3 -2 -1 0 +1 +2 +3 Z- Score IQ Score 55 70 85 100 115 130 145 IQ Score T- Score 20 30 40 50 60 70 90 T- Score Scaled Score 2 4 7 10 13 16 19
2 Scaled Score 1 2 16 50 84 98 99 %ile Rank 1 10 20 30 40 50 60 70 80 90 99 %ile Rank NOTE: Z-scores, IQ scores T-scores, and scaled scores are considered interval scales of measurement. These scores indicate rank and meaningfully reflect relative the distance between scores. Percentiles only indicate ranking, by themselves they do not indicate how far apart scores are. The Normal Curve The normal curve is a hypothetical distribution of scores that is widely used in Psychological Testing . The normal curve is a symmetrical distribution of scores with an equal number of scores above and below the midpoint.
3 Given that the distribution of scores is symmetrical ( , an equal number of scores actually are above and below the midpoint) the mean, median, and mode all fall at the same point. Since many psycho-educational measurements ( , intelligence and achievement test scores) assume a normal distribution, the concept of the normal curve is very important to school psychologists. If we divide the distribution up into standard deviations from the midpoint, a specific percentage of scores will lie under each part of the normal curve. As illustrated in the figure above, of the scores lie between the mean and 1 standard deviation above the mean.
4 This same percentage ( ) of scores lies between the mean and 1 standard deviation below the mean. Approximately two-thirds of the scores lie within 1 standard deviation of the mean ( ), and approximately 95% of the scores lie within 2 standard deviations of the mean. Finally, over 99% of the scores fall within 3 standard deviations of the mean. Thus scores that fall more than 2 standard deviations from the mean are relatively rare (sometime identified as being clinically significant ). 2 Standard deviation The standard deviation is a measure of the variability of a distribution of test scores.
5 Test developers need to know the standard deviation of the distribution of a tests raw scores before they can standardize these raw scores. Tests that have very little variability (the raw scores are very similar to each other) have small standard deviations, while tests that have significant variability (the raw scores obtained by individuals taking the test are very different from each other) have large standard deviations. The standard deviation of a distribution of raw scores is the square root of the variance. The variance is the sum of the squared raw score values ( X2) minus the square of the sum of all the raw scores ( X)2 divided by the number of raw scores (N).
6 The resulting figure is then divided by the number of raw scores minus 1 (N 1). This formula is summarized in the following figure: ( X)2 X2 - N N - 1 Standard Scores When a set of raw scores is converted to standard scores the scores are said to be standardized. The purpose of standard scores ( , Z-scores, IQ Scores, T-scores, scaled scores) is to transform individual raw scores into a standard form that provides a more meaningful description of the individual scores within the distribution. Raw test data is rarely valuable to the school psychologist. For example, a raw score of 5 on the Wechsler Intelligence Scale for Children (WISC) Information subtest may mean different things for different students.
7 A raw score of 5 for a six-year-old will be suggestive of a different level of cognitive functioning than will the same score for a seven-year-old. In addition, a raw score of 5 on one test will not have the same meaning as a raw score of 5 on another test. Thus, the raw scores obtained via Psychological tests are most commonly interpreted by reference to norms and by their conversion into some relative reference or standard score (a Descriptive statistic). Norms represent the test performance of individuals within a standardization sample. For example, they document how well the standardization sample s six-year-olds did on the WISC Information subtest.
8 Derived scores are the Descriptive Statistics used to transform raw test data into a number that more precisely illustrates a student s exact position relative to individuals in the normative group. For example, at age six, a raw score of 5 on the WISC Information subtest corresponds to a scaled score of 10. While at age seven, this same raw score corresponds to a scaled score of 6. Derived scores also provide comparable measures that allow direct comparison of a student s performance on different tests. Thus, allowing the school psychologist to identify a relative pattern of unique strengths and weaknesses.
9 For example, a scaled score of 10 on the Information subtest (RS = 5) can be directly compared to a scaled score of 3 on the Coding subtest (RS = 5). Understanding the conversion of raw scores into standard scores, and how they are used to describe a student s performance relative to others (as well as their own unique pattern of strengths and weaknesses) requires knowledge of basic statistical concepts. These concepts underlie the development and utilization of norms. It is critical that school psychologists, who use Psychological tests, have a solid understanding of these Descriptive Statistics .
10 Z-Scores Z-Scores are a transformation of individual raw scores into a standard form, where the transformation is based on knowledge about the standardization sample s mean and standard deviation . The formula for computing Z-scores is the individual raw score (X) minus the mean of the scores obtained by the standardization sample (M), divided by the standard deviation of scores obtained by the standardization sample (sd). Z-scores have a mean of 0 and a standard deviation of 1. A score that is one standard deviation below the mean has a Z-score of -1. A score that is at the mean would have a Z-score of 0.