Transcription of Design, Analysis and Testing of a Formula SAE Car Chassis
1 400 Commonwealth Drive, Warrendale, PA 15096-0001 Tel: (724) 776-4841 Fax: (724) 776-5760 Web: TECHNICALPAPER SERIES2002-01-3300 Design, Analysis and Testing of aFormula SAE Car ChassisWilliam B. Riley and Albert R. GeorgeCornell UniversityReprinted From: Proceedings of the 2002 SAE MotorsportsEngineering Conference and Exhibition(P-382)Motorsports EngineeringConference & ExhibitionIndianapolis, IndianaDecember 2-5, 2002 All rights reserved. No part of this publication may be reproduced, stored in a retrieval system, ortransmitted, in any form or by any means, electronic, mechanical, photocopying, recording, or otherwise,without the prior written permission of permission and licensing requests contact:SAE Permissions400 Commonwealth DriveWarrendale, PA 15096-0001-USAE mail: 724-772-4028 Tel: 724-772-4891 For multiple print copies contact:SAE Customer ServiceTel: 877-606-7323 (inside USA and Canada)Tel: 724-776-4970 (outside USA)Fax: 724-776-1615 Email.
2 0148-7191 Copyright 2002 SAE InternationalPositions and opinions advanced in this paper are those of the author(s) and not necessarily those of author is solely responsible for the content of the paper. A process is available by which discussionswill be printed with the paper if it is published in SAE wishing to submit papers to be considered for presentation or publication by SAE should send themanuscript or a 300 word abstract of a proposed manuscript to: Secretary, Engineering Meetings Board, in USA2002-01-3300 Design, Analysis and Testing of a Formula SAE Car Chassis William B. Riley1 and Albert R. George Cornell University Copyright 2002 SAE International 1 Currently with Ford Motor Company ABSTRACT This paper is taken from work completed by the first author as a member of the 1999 Cornell University Formula SAE Team and discusses several of the concepts and methods of frame design, with an emphasis on their applicability to FSAE cars.
3 The paper introduces several of the key concepts of frame design both analytical and experimental. The different loading conditions and requirements of the vehicle frame are first discussed focusing on road inputs and load paths within the structure. Next a simple spring model is developed to determine targets for frame and overall Chassis stiffness. This model examines the frame and overall Chassis torsional stiffness relative to the suspension spring and anti-roll bar rates. A finite element model is next developed to enable the Analysis of different frame concepts. Some modeling guidelines are presented for both frames in isolation as well as the assembled vehicle including suspension.
4 Finally, different experimental techniques are presented to determine what stiffness is actually achieved from a constructed vehicle. A comparison of frames tested in isolation versus whole vehicle Testing is made, and a simple whole-car Chassis torsion test method is discussed. INTRODUCTION This paper examines several aspects of vehicular frame design, with an emphasis on application to an open-wheeled, space-frame racecar Chassis , as is used in Formula SAE (FSAE). The FSAE competition is sponsored by the Society of Automotive Engineers (SAE). Some key questions that have been raised from year to year in designing FSAE cars at Cornell University are: What is the best way to transfer the loads through the structure?
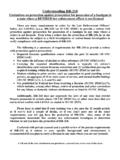
5 What are the deformation modes of the structure? How stiff should the frame be in each of the deformation modes? How does the frame stiffness affect the dynamic response of the car? All of these questions are discussed to varying degrees in this paper. VEHICLE LOADING The first step to designing a vehicle frame, or any structure, is to understand the different loads acting on the structure. The main deformation modes for an automotive Chassis are given in [8] as: 1. Longitudinal Torsion 2. Vertical Bending 3. Lateral Bending 4. Horizontal Lozenging 1. Longitudinal Torsion Figure 1: Longitudinal Torsion Deformation Mode Torsion loads result from applied loads acting on one or two oppositely opposed corners of the car.
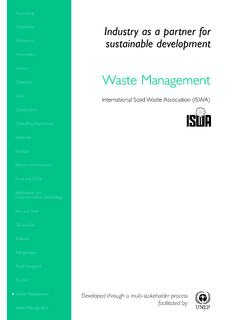
6 The frame can be thought of as a torsion spring connecting the two ends where the suspension loads act. Torsional loading and the accompanying deformation of the frame and suspension parts can affect the handling and performance of the car. The resistance to torsional deformation is often quoted as stiffness in foot-pounds per degree. This is generally thought to be the primary determinant of frame performance for a FSAE racecar. 2. Vertical Bending Figure 2: Vertical Bending Deformation Mode The weight of the driver and components mounted to the frame, such as the engine and other parts, are carried in bending through the car frame. The reactions are taken up at the axles. Vertical accelerations can raise or lower the magnitude of these forces.
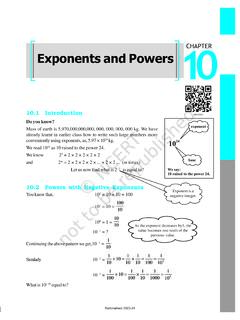
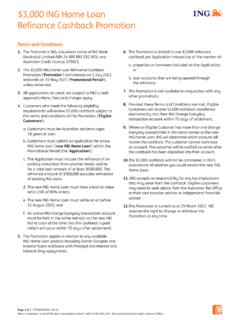
7 3. Lateral Bending Figure 3: Lateral Bending Deformation Mode Lateral bending loads are induced in the frame for various reasons, such as road camber, side wind loads and centrifugal forces caused by cornering. The side-ways forces will act along the length of the car and will be resisted at the tires. This causes a lateral load and resultant bending. 4. Horizontal Lozenging Figure 4: Horizontal Lozenging Deformation Mode Forward and backward forces applied at opposite wheels cause this deformation. These forces may be caused by vertical variations in the pavement or the reaction from the road driving the car forward. These forces tend to distort the frame into a parallelogram shape as shown in the figure.
8 It is generally thought that if torsional and vertical bending stiffness are satisfactory then the structure will generally be satisfactory. Torsional stiffness is generally the most important as the total cornering traction is a function of lateral weight transfer. STRAIN GAUGE DATA The magnitude of the loads mentioned in the proceeding section changes with the operating mode of the car. Based on over ten years of experience with Cornell FSAE cars, parts designed to withstand both individual and combined g bump, g braking and g lateral acceleration have been found to meet durability requirements. Thus, these loads have to be considered individually and together.
9 To verify these historical guidelines the 1998 Cornell Car was instrumented with strain gauges on the major suspension links. The strain gauge data was recorded at 100 Hz while the car was driven through several different representative tracks and situations. Some data from a skid pad run is shown below. Figure 5: Strain Gauge Data In one particular run the peak vertical force encountered on the corner of the car was 450 pounds, which corresponded to a vertical acceleration of g s, assuming a 125 pound corner weight. This results in a stress of 19 KSI in a in diameter pull link with a in wall thickness. The strain gauge data can also be used to gain insight in to the natural frequencies of the vehicle.
10 This is accomplished by transforming the data from the time domain to the frequency domain and plotting the response. Taking one of the data files a fast Fourier transform was performed on the entire time history. Then plotting the coefficients versus the appropriate frequency we can observe spikes at the natural frequency of the system. For the first sample plot, we note a high-response at low frequencies, say below 2 Hz. There is another significant spike at roughly 5 Hz and periodic spikes occurring at 8, 11, 15 Hz and so on. If we compare this data to an ANSYS natural frequency response prediction (albeit for a different car the 1999 car), presented later, we observe the behavior is very similar.