Transcription of Detecting Wormholes in Friction Stir Welds
1 Detecting Wormholes in Friction stir Welds from Welding Feedback Data Enkhsaikhan Boldsaikhan National Institute for Aviation Research Wichita State Univ. Wichita, KS 67260 Edward Corwin Antonette Logar Jeffrey McGough Mathematics and CS SDSM&T Rapid City, SD 57701 William Arbegast AMP Center SDSM&T Rapid City, SD 57701 ABSTRACT This work describes a new non-destructive evaluation technique for Detecting Wormholes in Friction stir Welds . Feedback gathered during welding in both the time and frequency domains can be used to indicate the presence of a defect. Binned DFT frequencies of feedback signals were used as feature vectors for training a neural network. The approach was successful, recognizing 95% of novel inputs, but the network s ability to generalize is limited. Phase space analysis, a technique for comparing the signal to its time-derivative, provides a more robust option.
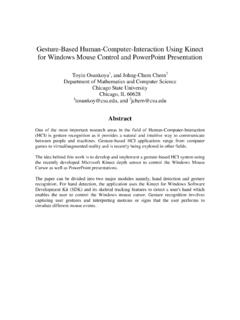
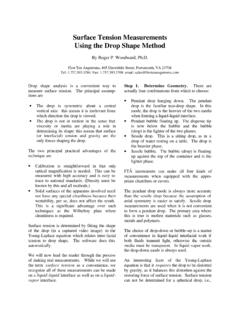
2 Characterization of both the degree of circularity of the phase space diagram and the extent to which it is stationary has been tied to material flow and to defect formation. This technique was capable of Detecting weld defects with 81% accuracy. 1. INTRODUCTION Friction stir welding (FSW) is an innovative technique for joining metals that was developed and patented by The Welding Institute of Cambridge, England in 1991 [1]. In this work, a threaded probe with shoulder (pin tool) was rotated and plunged into the joint line between two workpieces forming a butt joint (Figure 1). Friction between the wear-resistant pin tool and material generates sufficient heat to plasticize the work pieces without melting. The rotation of the pin tool plays two important roles. First, it generates heat due to the Friction , and second, it stirs the two plasticized work pieces together.
3 As soon as the material reaches a plastic state, the rotating pin tool travels along the joint line and creates a solid-state bond between the two work pieces. While traveling along the joint line, the rotating pin tool has to have a downward forge load to maintain registered contact with the work pieces. Thus, three important parameters must be defined when making a weld : how fast the pin tool rotates, how fast the pin tool travels forward joining the two pieces, and how much force is exerted on the pin tool to maintain contact between the shoulder and the work pieces. FSW has numerous advantages over fusion welding. It offers the ability to weld previously difficult or impossible combinations of materials, creates less distortion, allows for retention of parent material properties, requires lower energy consumption, produces diminished residual stresses, and is friendlier to the environment [2]-[5].
4 However, despite the simplified processing, an improper selection of system parameters may result in a weld with undesirable defects. One of the most common defects associated with FSW is a wormhole, a cavity completely below the weld surface undetectable to a human operator. The primary cause of a wormhole defect is abnormal material flow during welding. Because of the reduced joint area between the work pieces, Wormholes severely weaken the mechanical properties of the weld bond. The research to date has concentrated on determining the presence of wormhole defects from feedback captured from the machine while the weld is being made. The final goal is a control algorithm that will adjust system parameters in real-time to prevent wormhole formation. Note that many factors may contribute to wormhole formation, such as clamping or pin tool geometry, but this study only varies the three parameters listed above, rotation speed, travel speed, and downward force, the thickness of the aluminum, and the alloy.
5 Figure 1: Drawing of a typical FSW pin tool 2. THE DATA As noted above, an interesting problem in many FSW applications is how to determine the presence of Wormholes . X-ray techniques have a high degree of accuracy, but the equipment needed to test the weld may not be available or feasible to use in all situations. This research provides an alternative technique in which feedback captured during the welding process is used for performing non-destructive evaluation of the weld quality. The welding machine in use at the Center for Friction stir Processing (CFSP) on the SDSM&T campus is an ISTIR-10 capable of recording a variety of feedback forces. The X feedback force is a measure of resistance to the weld in the direction of travel of the pin tool as a weld is being made, Z feedback force provides feedback on the force exerted in opposition to that of the downward pressure placed on the pin tool, and the Y feedback force measures the amount of sideways movement made during the weld .
6 Note that Welds can be made under position control or forge force control. In position control, the pin tool is placed at a particular height and remains at that fixed position. In forge force, a constant amount of downward pressure is maintained throughout the weld . Thus, greater variation would be expected in the Z feedback under position control than under forge force control. Correlation analysis indicates that the distribution of frequencies in the frequency spectra of the X, Y, and Z feedback forces are all indicators of weld quality to some degree, but the Y force appears to be the most strongly tied to the weld quality. Two approaches to using the feedback forces are described in this work : one uses the time domain feedback force data as captured by transducers on the weld head assembly of the pin tool, and the other uses the frequency spectra of these signals.
7 Time Domain Data One of the obstacles to evaluating weld quality from the Y feedback, or any feedback parameter, is the presence of noise in the output signal. The welding process does not occur in an ideal environment but rather is influenced by external factors such as temperature, metallurgical variations, edge inconsistencies etc., as well as by the inevitable machine-specific variability. Investigations are on-going to identify and characterize all of the types of noise that contribute to the composition of the feedback signals, but, at present, only mechanical vibration noise is removed by a low-pass filter. The filter was implemented by computing the discrete Fourier transform (DFT) of the time series data, excising the high frequency components from the DFT, and computing the inverse DFT.
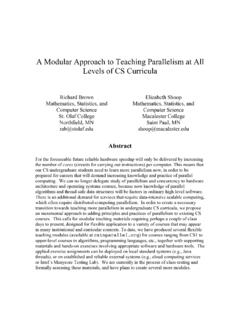
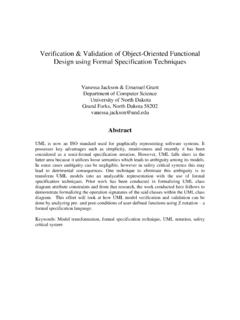
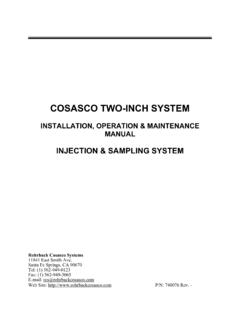
8 High frequency components are defined to be those above the spindle frequency, where the spindle frequency index is found by : index = spindle RPM / (60 * sampling rate (Hz) / number of points in DFT) Figure 2(a) shows a sample of the original time series data (FSW06048-5) generated for a butt weld of two pieces of inch thick aluminum 7075 welded at 8 ipm, with a pin tool speed of 200 rpm, using forge force control and sampled at a rate of Hertz. Figure 2(b) presents the 256 point discrete Fourier transform of the original time series signal and indicates the spindle frequency for this sample, calculated from the equation above, to be at index (rounded up 13) in the DFT array. Figure 2(c) shows the filtered time series data. The resulting signal is smoother, but more importantly, the trends in the data are more apparent once the high frequency noise is removed.
9 The appropriateness of using a low pass filter for removing mechanical vibration noise during Friction stir welding was noted in [4]. The resulting filtered time series data is used for the phase space analysis described briefly above and in more detail in a later section. -660-640-620-600-580-560-540-520-500-480 0 102030405060708090100 Time indexForce in lbf 0500100015002000250030000100200300400500 600700800 DFT IndexDFT Value -660-640-620-600-580-560-540-520-500-480 0 102030405060708090100 Time indexForce in lbf Figure 2: (a) Upper Left: the raw y force data. (b) Upper Right: the DFT for the data with the spindle frequency indicated (c) Bottom: the data after the low pass filter. Frequency Domain Data The neural network approach described below requires data to be transformed into feature vectors, compact representations of the data that retain the information necessary to group input vectors into classes.
10 Often, large data sets can be segmented into small pieces and presented to the network for classification with little transformation. In this case, using small segments of the time domain data was not suitable as input to a neural network. Given the periodic nature of the welding process and the underlying material flow mechanics, frequency information is essential for recognizing patterns [6]-[11]. A discrete Fourier Transform was applied to the X, Y, and Z feedback forces for each set of feedback data, and the resulting frequency spectra were analyzed. Unstable material flow, the root cause of wormhole defects, appears to manifest itself in the frequency spectrum by an increase in low frequency components. Figure 3 depicts examples of the frequency spectra for a good (pictures a and b) and a bad (pictures d and e) weld generated from the X and Y feedback forces.