Transcription of Determination of chlorate and chlorite in water samples by ...
1 Concordia College Journal of Analytical Chemistry 1 (2010), 9-13 9 Determination of chlorate and chlorite in water samples by ion chromatography Andresa Carlson and Vanessa Kowalski Department of Chemistry, Concordia College, 901 8th St S, Moorhead, MN 56562 Abstract chlorate (ClO3-) and chlorite (ClO2-) are two anions commonly found in municipal water due to the treatment with chlorine dioxide (ClO2). chlorate and chlorite in water may have potential health implications; therefore it is important to monitor these anion levels.
2 Ion chromatography was used to analyze tap water from Fargo, ND and Moorhead, MN as well as the recreational swimming pool of Park East Apartment Complex in Fargo, ND. Neither chlorite nor chlorate were detected in the tap water of either city and a concentration of chlorate exceeding levels considered safe for consumption was found in the Park East Apartment Complex pool; chloride was also present in the pool water . Introduction Chlorine dioxide (ClO2) is a chemical commonly used in the treatment of water .
3 It acts as a disinfectant and can be used to alter both the taste and odor of water . Two important and related species are sodium chlorate and sodium chlorite , both of which are used in the preparation of chlorine dioxide. chlorate and chlorite are also two of the t hre e products of the decomposition of chlorine dioxide in water a process that occurs rapidly. chlorite is the predominant decomposition product with chlorate and chloride also being produced. Thus, water treated with chlorine dioxide contains both chlorate and chlorite .
4 As a result, consumption of drinking water treated with chlorine dioxide is the major source of environmental exposure to chlorate and Exposure to chlorate has been linked to a decrease in brain mass and alteration of liver mass in rats, and exposure to chlorite has been linked to changes in thyroid function in In humans, both chlorate and chlorite exposure have resulted in changes in red blood cells due to oxidative stress. As there is the potential for adverse impacts due to high exposure to chlorate and chlorite , it is important to know how much chlorate and chlorite are present in w a te r.
5 The World Health Organization (WHO) has s e t the acceptable level of both chlorate and chlorite in drinking water at mg/L and the Environmental Protection Agency (EPA) requires that drinking water in the United States not exceed mg/L chlorate or ,2 A relatively easy way to determine the concentrations of chlorate and chlorite in water is through ion chromatography (IC).3 Standard solutions of known concentrations of chlorate and chlorite can be analyzed in order to create a calibration curve. Use of this calibration curve can aid in the Determination of the chlorate and chlorite levels in water samples of unknown Concordia College Journal of Analytical Chemistry 1 (2010), 9-13 10 Experimental Materials and reagents Tap water samples were collected from a water fountain at the Park East Apartment Complex in Fargo, North Dakota and a water fountain in the Ivers Building at the Concordia College campus in Moorhead, Minnesota.
6 Pool water samples were collected for a chlorinated pool at the Park East Apartment Complex in Fargo, ND. Ion chromatography chlorite standard stock solution with a concentration of 1000 mg/L was purchased from SPEX (Metuchen, NJ), and chlorite standards with a varied concentration ranging from mg/L to 15 mg/L were prepared from the dilution of the stock solution. chlorate standard stock solution was prepared from sodium chlorate salt technical grade purchased from Sigma-Aldrich (St.)
7 Louis, MO) and dissolved in de-ionized water to a final stock concentration of 1000 mg/L. Standard chlorate solutions were prepared from the dilution of the stock sample to concentrations ranging from 2 mg/L to 15 mg/L. Sodium bicarbonate and sodium hydroxide used to make the ion chromatography eluent were purchased from Sigma-Aldrich (St. Louis, MO). Eluent preparation Ion chromatography eluent was prepared by dissolving g sodium bicarbonate in 300 mL of degassed ultrapure water . The pH of the solution was adjusted to with the addition of M sodium hydroxide with constant stirring.
8 The pH solution was then diluted to a final volume of 500 mL with degassed ultrapure water . Sample preparation Tap water samples collected from both Fargo and Moorhead were diluted with de-ionized by a factor of 10. Pool water samples collected from Fargo were diluted by a factor of 100 with de-ionized water . All diluted samples were then used directly for IC analysis. Instrument Preparation The IC analysis was carried out on a Metrohm ion chromatography system with a conductivity detector. Analytes were separated on a Metrosep A Supp 5-100 column, 100 mm and a particle size of m.
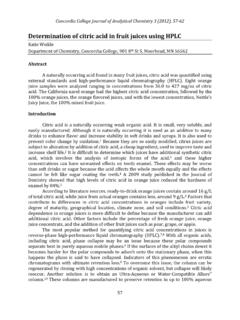
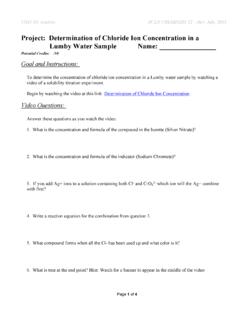
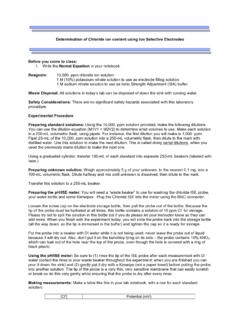
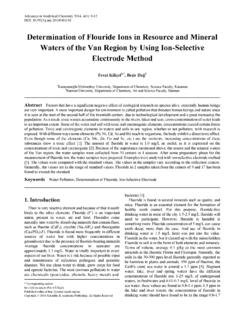
9 The column temperature was C, the flow rate was mL/min, and the injection loop volume was L. Results and discussion Calibration curves A strong signal around a retention time of minutes was present in all chlorate standard chromatograms (Fig. 1) and was selected as the quantitative signal for chlorate . The calibration curve (Fig. 3) was constructed by plotting the measured peak areas versus Concordia College Journal of Analytical Chemistry 1 (2010), 9-13 11 concentrations of the chlorate standards.
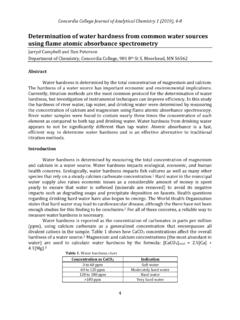
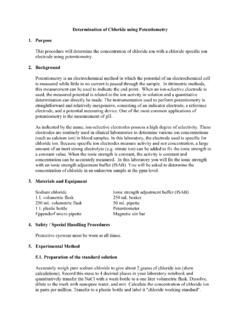
10 Exceptional linearity was obtained within t h e range of concentrations 2-15 mg/L, resulting in a correlation coefficient of Fig. 1. Sample chromatogram of chlorate standard with a concentration of 5 ppm. A strong signal around a retention time of minutes and a weaker signal around a retention time of minutes were present on all chlorite standard chromatograms (Fig. 2) and were selected as the quantitative signals for chlorite . The calibration curves (Fig. 3) were constructed by once again plotting the measured peak areas versus the concentrations of the chlorite standards.