Transcription of Determination of Relative Fluorescence Quantum Yields ...
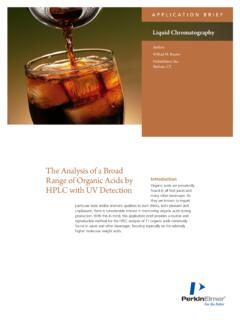
1 APPLICATION NOTE. Fluorescence Spectroscopy Authors: Kathryn Lawson-Wood Steve Upstone Kieran Evans PerkinElmer, Inc. Seer Green, UK. Determination of Relative Fluorescence Quantum Introduction Fluorescence Quantum yield ( F) is a Yields using the FL6500 characteristic property of a fluorescent Fluorescence Spectrometer species and is denoted as the ratio of the number of photons emitted through Fluorescence , to the number of photons absorbed by the fluorophore (Equation 1). F ultimately relates to the efficiency of the pathways leading to emission of Fluorescence (Figure 1), providing the probability of the excited state being deactivated by Fluorescence rather than by other competing relaxation processes. The magnitude of F is directly related to the intensity of the observed Number of photons emitted through Fluorescence F = (1).
2 Number of photons absorbed Fluorescence Quantum yield can be measured using two methods: the absolute method and the Relative method. Relative F measurements are achieved using the comparative method. Here, the F of a sample is calculated by comparing its Fluorescence intensity to another sample of known F (the reference). Unlike absolute Quantum yield measurements, which require an integrating sphere, the Relative method uses conventional Fluorescence spectrometers with a standard single cell The Relative method does, however, require knowledge of the absorbance of both the reference and the sample. The importance of F has been shown in several industries, sample of unknown F. This approach is only applicable to including the research, development and evaluation of audio samples which can go into solution because the measurement visual equipment, electroluminescent materials (OLED/LED), requires knowledge of the refractive index of the solvent, and dyes/pigment and fluorescent probes for biological the absorbance of both reference and sample.
3 The Relative This application note demonstrates the use of the PerkinElmer method provides good accuracy for solution phase samples FL6500 Fluorescence spectrometer and Spectrum FL software (as it uses the gradients to calculate the F), with the added for the Determination of Relative F of rhodamine B using the benefit of not requiring an integrating comparative method. The FL8500 may also be used. Spectrum The fundamental principle of the comparative method is that FL provides an easy-to-use inbuilt method for measuring the two solutions ( the reference and the test sample) with F of samples with the option of choosing either the Relative identical absorbance at the excitation wavelength can be or absolute measurement. Rhodamine 6G, which has a known assumed to be absorbing the same number of photons.
4 F of , was used as the reference material in this Therefore, providing the experimental conditions remain the same, the ratio of the integrated Fluorescence intensities of the two solutions can be related to the ratio of the F It is possible to estimate the F by simply using the absorbance and integrated Fluorescence intensities of a single reference and test sample, generally referred to as the single-point method. Although this single-point method is quick, it can result in large inaccuracies in the Quantum yield measurements due to inaccurate measurement of solution absorbance. It is, therefore, advisable to measure the Fluorescence intensity of the reference and test samples over a range of absorbances at the excitation wavelength. Two calibration curves of the integrated Fluorescence intensity (emission peak area) as a function of solution absorbance may then be plotted, and the Quantum yield obtained using the The F of the test sample using the comparative method is determined using Equation 2 when a rhodamine Quantum - Figure 1.
5 Jablonski diagram illustrating the main primary deactivation processes corrected reference system is used. Equation 2 can be simplified to following excitation from the ground electronic singlet state (S0) to excited electronic singlet states (S1 and S2).5 Equation 3 by combining the ER and AR terms (and also the ES and AS terms) as their ratio is equal to the gradient of the calibration line Relative vs. absolute Fluorescence Quantum Yields produced when plotting the integrated Fluorescence intensity The absolute method is applicable to both solid and solution against solution absorbance. If the same solvent is used for both the phase measurements and the F can be determined in a single reference and unknown samples then the value of (ns/nr ) 2 is equal measurement without the need for a reference standard or to 1.
6 Therefore, the Fluorescence Quantum yield of the unknown is absorbance data. It is especially useful for samples which absorb obtained from the product of the Quantum yield of the reference and emit in wavelength regions for which there are no reliable and the quotient of the two ,11,12. Quantum yield standards available. This method, however, Method requires an integrating sphere which allows the instrument to A E n 2. collect all of the photons emitted from the sample. By simply Qs = Qr ) Ars ) ) Esr ) ) nsr ) (2). comparing the total number of emitted photons with the total number of absorbed photons, the absolute F of the sample m n 2. can be ,7 Qs = Qr ) msr ) ) nsr ) (3). The Relative comparative method, on the other hand, is the most common way of determining the F of samples.
7 It relies on the Where: use of well-characterised reference standards, with known F Q = Fluorescence Quantum yield values and optical properties closely matching the sample of m = Gradient of the plot of integrated Fluorescence intensity interest. It uses a conventional Fluorescence spectrophotometer against absorbance which detects only a fraction of the light emitted due to a wide n = Refractive index of the solvent range of factors including the refractive index of the solvent, A = Absorbance of the solution scattering of light by the sample, the emission wavelength and the 90 arrangement of the excitation and emission To E = Integrated Fluorescence intensity of the emitted light calculate the F value of the unknown, the Relative method Subscripts r' and s' refer to the reference and unknown compares the integrated Fluorescence intensity of a sample of fluorophore respectively known F, generally referred to as the reference, against the 2.
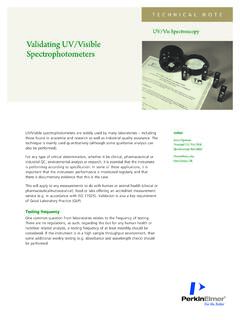
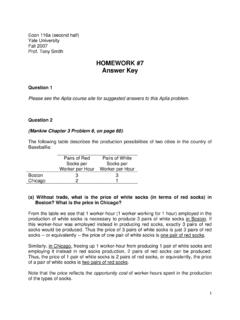
8 Quantum yield measurements require the absorbance (optical density) of the solution at the absorption maxima to be < , thus appropriate sample concentrations must be prepared. Limiting the absorbance to below minimizes non-linear effects arising from inner filter (re-absorption) effects, which may otherwise skew the resulting Quantum Fluorescence grade rhodamine 6G, Fluorescence grade rhodamine B, and 200-proof anhydrous ethanol ( %) were obtained from Merck (previously Sigma-Aldrich). Rhodamine 6G (used as the reference sample) and rhodamine B (used as the unknown sample). were chosen as they have similar excitation and emission profile. Five standard solutions in ethanol were prepared each for Figure 2. PerkinElmer FL6500 Fluorescence Spectrometer. rhodamine B and rhodamine 6G, with absorbance values between at the excitation wavelength of 537 nm.
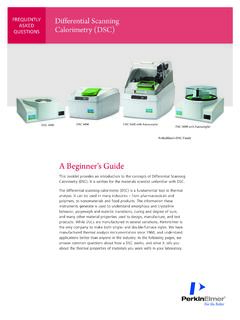
9 The absorbance of each solution was determined using a PerkinElmer LAMBDA 265 UV/Vis Spectrophotometer using PerkinElmer UV. Lab software. In the absence of a separate UV-Vis instrument, the PerkinElmer FL6500 or FL8500 Fluorescence Spectrometer's absorbance module accessory (P/N: N4201018) can be used. All samples were measured using the PerkinElmer FL6500. Fluorescence Spectrometer (Figure 2) with a standard single cell holder accessory (Figure 3, P/N: N4201010). The PerkinElmer FL8500 Fluorescence Spectrometer may also be used. Quartz Fluorescence cuvettes (10 x 10 mm) were used with a white PTFE. stopper to prevent solution evaporation. Emission spectra were background corrected using a solvent blank, in order to correct for any emission arising from the solvent.
10 The Quantum Yield Figure 3. Standard single cell holder accessory (P/N: N4201010) in the FL6500. Method Setup' in Spectrum FL software was used in Relative and FL8500 Fluorescence Spectrometers. mode with the instrument settings specified in Table 1. Table 1. PerkinElmer FL6500 scanning parameters using Relative mode. Results Scan Settings Fluorescence spectra of the varying concentrations of rhodamine Excitation Correction On 6G and rhodamine B are shown in Figure 4, with the absorbance Initial Dark On values and integrated Fluorescence intensities of these samples Source shown in Table 2. Power (kW) 80. Frequency (Hz) 100. Spectrum FL automatically calculates the integrated Fluorescence intensity (peak area) of each of the reference and unknown samples Excitation Wavelength (nm) 537.