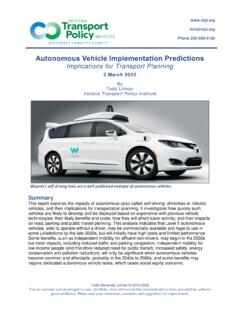
Transcription of DRIV Global X Autonomous & Electric Vehicles ETF ...
1 ETF Category: Thematic Growth . DRIV. Global X Autonomous & Electric Disruptive Technology Vehicles ETF As of 11/30/2021. KEY FEATURES FUND DETAILS. Inception Date 04/13/2018. Solactive Autonomous &. High Growth Potential Underlying Index Electric Vehicles Index While Global EV registrations increased by more than 40% in 2020, EVs were still less than 5% of new cars sold, highlighting substantial room for further adoption.(1) Number of Holdings 76. Assets Under Management $1, mil Total Expense Ratio Distribution Frequency Semi-Annually Advancing Clean Technologies EVs produce zero direct emissions, meaning broader adoption could result in reduced greenhouse TRADING DETAILS. gas emissions and improved urban air quality. Further advances in Autonomous driving could also Ticker DRIV. enhance roadway safety.(2). CUSIP 37954Y624. Exchange NASDAQ. Bloomberg IOPV Ticker DRIVIV.
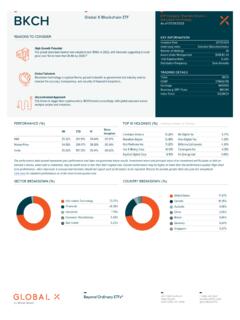
2 Unconstrained Approach This theme is bigger than any single company. DRIV invests accordingly, with Global exposure across Index Ticker SOLDRIV. multiple sectors and industries. PERFORMANCE (%) TOP 10 HOLDINGS (%) Holdings Subject to Change Since 1M YTD 1Y 3Y. Inception Tesla Inc Alphabet Inc-cl A NAV Nvidia Corp Toyota Motor Corp Market Price Qualcomm Inc Intel Corp Index Microsoft Corp Xilinx Inc Apple Inc Ford Motor Co The performance data quoted represents past performance and does not guarantee future results. Investment return and principal value of an investment will fluctuate so that an investor's shares, when sold or redeemed, may be worth more or less than their original cost. Current performance may be higher or lower than the performance quoted. High short- term performance of the Fund, when observed, is unusual and investors should not expect such performance to be repeated.
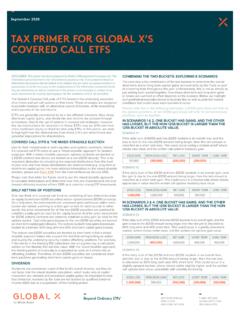
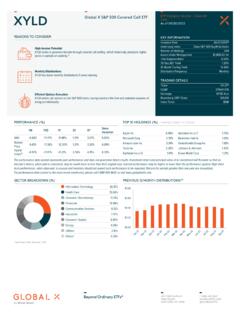
3 Returns for periods greater than one year are annualized. Click here for standard performance as of the most recent quarter-end. INDUSTRY BREAKDOWN (%) COUNTRY BREAKDOWN (%). Motor Vehicles United States Semiconductors Japan Auto Parts: OEM China Telecommunications Equipment Netherlands Internet Software/Services Germany Chemicals: Specialty Australia Electrical Products Ireland Other Metals/Minerals Canada Packaged Software South Korea Others* Others* * Industrial Machinery , Trucks/Construction/Farm Machinery , Steel , Precious Metals , Industrial * Britain , France , Chile , Hong Kong , Belgium , Luxembourg Conglomerates , Office Equipment/Supplies , Electronic Components , Chemicals: Agricultural , Electronics/Appliances , Industrial Specialties , Electronic Equipment/Instruments , Chemicals: Major Diversified , Investment Managers RISK CHARACTERISTICS SINCE ETF INCEPTION.
4 Solactive Autonomous & Electric Vehicles Index MSCI ACWI Index Annualized Volatility Beta Sharpe Ratio 605 THIRD AVENUE 1 (888) 493-8631. 43RD FLOOR NEW YORK, NY 10158 DRIV Global X Autonomous & Electric Vehicles ETF As of 11/30/2021. DEFINITIONS. Solactive Autonomous & Electric The Solactive Autonomous & Electric Vehicles Index tracks the price movements in shares of companies which are active in the Electric Vehicles Index Vehicles and Autonomous driving segments. This particularly includes Electric vehicle manufacturers, Electric vehicle component producers, companies that mine or produce raw materials that are relevant to the Electric vehicle and Autonomous vehicle technology segment, companies that build Autonomous Vehicles , and suppliers of Autonomous vehicle technologies. MSCI ACWI Index MSCI ACWI Index captures large and mid cap representation across 23 Developed Markets (DM) and 27 Emerging Markets (EM) countries.
5 The index covers approximately 85% of the Global investable equity opportunity set. DM countries include: Australia, Austria, Belgium, Canada, Denmark, Finland, France, Germany, Hong Kong, Ireland, Israel, Italy, Japan, Netherlands, New Zealand, Norway, Portugal, Singapore, Spain, Sweden, Switzerland, the UK and the US. EM countries include: Argentina, Brazil, Chile, China, Colombia, Czech Republic, Egypt, Greece, Hungary, India, Indonesia, Korea, Kuwait, Malaysia, Mexico, Pakistan, Peru, Philippines, Poland, Qatar, Russia, Saudi Arabia, South Africa, Taiwan, Thailand, Turkey and United Arab Emirates. Annualized Volatility The annualized standard deviation of the daily returns of the security using the closing levels of the index during the 22 index-day period preceding that day. Beta Measures the volatility of the Fund price relative to the volatility in the market index and can also be defined as the percent change in the price of the Fund given a 1% change in the market index.
6 A beta below one suggests that the Fund was less volatile than the market benchmark. Sharpe Ratio Measures the return for each unit of risk. The risk free rate is subtracted from the mean return and is divided by the standard deviation of returns. (1) International Energy Agency, Apr 2021. (2) US Office of Energy Efficiency & Renewable Energy, Jan 2020. Investing involves risk, including the possible loss of principal. The investable universe of companies in which DRIV may invest may be limited. The companies in which the Fund invests may be subject to rapid changes in technology, intense competition, rapid obsolescence of products and services, loss of intellectual property protections, evolving industry standards and frequent new product productions, and changes in business cycles and government regulation. There are additional risks associated with investing in mining industries.
7 International investments may involve risk of capital loss from unfavorable fluctuation in currency values, from differences in generally accepted accounting principles or from social, economic or political instability in other nations. Emerging markets involve heightened risks related to the same factors as well as increased volatility and lower trading volume. DRIV is non-diversified. The information provided is not intended for trading purposes, and should not be considered investment advice. Carefully consider the Fund's investment objectives, risk factors, charges, and expenses before investing. This and additional information can be found in the Fund's full or summary prospectus, which may be obtained by calling , or by visiting Please read the prospectus carefully before investing. Shares of ETFs are bought and sold at market price (not NAV) and are not individually redeemed from the Fund.
8 Brokerage commissions will reduce returns. Beginning October 15, 2020, market price returns are based on the official closing price of an ETF share or, if the official closing price isn't available, the midpoint between the national best bid and national best offer ( NBBO ) as of the time the ETF calculates current NAV per share. Prior to October 15, 2020, market price returns were based on the midpoint between the Bid and Ask price. NAVs are calculated using prices as of 4:00 PM Eastern Time. The returns shown do not represent the returns you would receive if you traded shares at other times. Indices are unmanaged and do not include the effect of fees, expenses or sales charges. One cannot invest directly in an index. Global X Management Company LLC serves as an advisor to the Global X Funds. The Funds are distributed by SEI Investments Distribution Co.
9 (SIDCO, 1 Freedom Valley Drive, Oaks, PA, 19456), which is not affiliated with Global X Management Company LLC or Mirae Asset Global Investments. Global X Funds are not sponsored, endorsed, issued, sold or promoted by Solactive AG, nor does Solactive AG make any representations regarding the advisability of investing in the Global X Funds. Neither SIDCO, Global X nor Mirae Asset Global Investments are affiliated with Solactive AG. 605 THIRD AVENUE 1 (888) 493-8631. 43RD FLOOR NEW YORK, NY 10158