Transcription of Driving under the (Cellular) Influence - CMU
1 92 American Economic Journal: Economic Policy 2013, 5(3): 92 125 under the ( cellular ) Influence By Saurabh Bhargava and Vikram S. Pathania*We investigate the causal link between driver cell phone use and crash rates by exploiting a natural experiment induced by the 9 pm price discontinuity that characterizes a majority of recent cellular plans. We first document a percent jump in driver call likelihood at the 9 pm threshold. Using a prior period as a comparison, we next document no corresponding change in the relative crash rate. Our estimates imply an upper bound in the crash risk odds ratio of , which rejects the asserted by Redelmeier and Tibshirani (1997). Additional panel analyses of cell phone ownership and cellular bans confirm our result. (JEL R41)Does talking on a cell phone while Driving increase your risk of a crash? The popular belief is that it does a recent New York Times/CBS News sur-vey found that 80 percent of Americans believe that cell phone use should be This belief is echoed by recent research.
2 Over the last few years, more than 125 published studies have examined the impact of driver cell phone use on vehicular In an influential paper published in the New England Journal of Medicine, Redelmeier and Tibshirani (1997) henceforth, RT concluded that cell phones increase the relative likelihood of a crash by a factor of Laboratory and epidemiological studies have further compared the relative crash risk of phone use while Driving to that produced by illicit levels of alcohol (RT; Strayer, Drews, and Crouch 2006).If alcohol, however, is responsible for 40 percent of fatal and 7 percent of all crashes each year, as reported by the National Highway Traffic Safety Administration 1 The survey relied on a sample of 829 adults and was administered by phone in October 2009. The question referred specifically to handheld cellular use. The survey is reported at As counted by McCartt, Hellinga, and Bratiman 2006.
3 * Bhargava: Department of Social and Decision Sciences, Carnegie Mellon University, 5000 Forbes Avenue, Pittsburgh, PA, 15213 (e-mail: Pathania: Department of Management, London School of Economics, Houghton Street, London, WC2A 2AE (e-mail: The authors thank Alan Auerbach, Pranab Bardhan, Dan Black, David Card, Raj Chetty, Stefano DellaVigna, Liran Einav, Ray Fisman, Robert Hahn, Michael Greenstone, Jon Guryan, Emir Kamenica, Botond Koszegi, Prasad Krishnamurthy, Ritu Mahajan, Ted Miguel, Enrico Moretti, Omar Nayeem, James Prieger, Matthew Rabin, Jesse Shapiro, Aman Vora, Glenn Woroch as well as seminar participants at the Economics Department at UC Berkeley, the Goldman School of Public Policy at UC Berkeley, Harvard Business School, the Harvard School of Public Health, the Mailman School of Public Health at Columbia University, and the University of Chicago Booth School of Business for their thoughtful comments.))
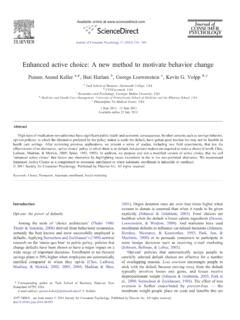
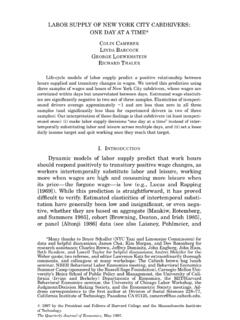
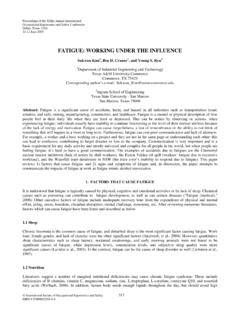
4 Glenn Woroch, Gregory Duncan, Nathan Eagle, Ashwin Sridharan and Econ One Research made essential data contributions. We would also like to thank the UC Berkeley s IBER for providing funding for this project. Despite the generous contributions and insights of many, all remaining errors are our own. Go to to visit the article page for additional materials and author disclosure statement(s) or to comment in the online discussion . 5 NO. 3 93 BHARGAVA AND PATHANIA: Driving under THE ( cellular ) Influence (NHTSA), then Figure 1 illustrates a puzzle. Cell phone ownership ( , cellular subscribers/population) has grown sharply since 1988, average use per subscriber has risen from 140 to 740 minutes a month since 1993, and surveys indicate that as many as 81 percent of cellular owners use their phones while Driving yet aggre-gate crash rates have fallen substantially over this study has yet provided causal evidence of the relationship between cell phone use and crashes in the field.
5 In this paper, we adopt a unique approach, and novel data, to estimate the causal link between cellular use and the crash rate. Specifically, we exploit a natural experiment which arises from a feature characterizing a large share of cellular phone plans from 2002 to 2005 a discontinuity in the marginal price of a phone call at 9 pm on first provide evidence that this discontinuity in prices drives a sharp increase in the likelihood of calling for drivers using a proprietary dataset of calls from a leading network provider. Our data are restricted to calls routed through multiple cell phone towers in a contiguous region just outside of a major California down-town area during an eleven day period in 2005. Given the mechanics of call routing and signal switching, the calls could have been placed only by callers in moving vehicles. While scaled for confidentiality, we estimate the data comprises 106,000 to 477,000 calls placed by moving callers within a region spanned by 300 to 400 cell phone towers.
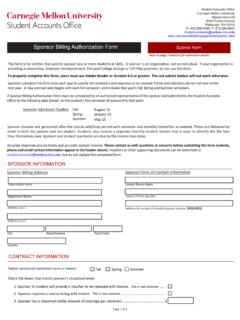
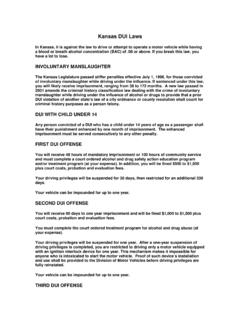
6 To our knowledge, our paper is the first in the literature to use a large call-level dataset directly from a US provider, and moreover, it is the first to feature call data from moving 2 presents this distribution of cell phones calls by likely drivers across Mondays to Thursdays, Fridays, and weekend evenings. While the downward slopes reflect the pattern of traffic across evenings, driver call likelihood rises by percent at the 9 pm threshold when prices transition from peak to off peak. We find no comparable breaks in likelihood for neighboring hours or at 9 pm on weekends. We crashes per billion highway miles traveledCellular ownership (as a share of US population)FatalcrashesAll crashesCellular ownershipFigure 1. cellular Ownership and Crashes Per Vehicle Mile Traveled in the United States for 1988 to 200594 AMERICAN ECONOMIC JOURNAL: ECONOMIC POLICY AUGUST 2013present additional evidence on cell phone calls (this time by drivers and nondrivers) and 30,000 pricing plans across 26 markets to affirm the sensitivity of cellular users to the 9 pm price threshold.
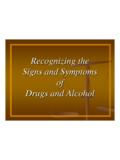
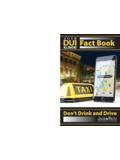
7 The rise in call likelihood at 9 pm represents the first stage of our next test whether the rise in call likelihood at the threshold leads to a cor-responding rise in the crash rate. In order to smooth crash counts that are subject to well recognized periodicity due to reporting conventions, we aggregate crashes into bins of varying sizes. While this strategy improves estimate precision, it introduces a bias due to potential covariate changes away from the threshold. To account for such movement in covariates, we adopt a double-difference approach to compare the change in crashes at the threshold to the analogous change in a control period prior to the prevalence of 9 pm pricing plans and characterized by low cellular 3 plots the universe of crashes for the state of California on Monday to Thursday evenings in 2005 and during the control period from 1995 to The plot, and subsequent regressions, indicate that crash rates in 2005, or in the extended time frame of 2002 to 2005, do not appear to change across the 9 pm threshold rela-tive to the preperiod.
8 We then generalize our crash analysis to include eight addi-tional states for which we have the universe of crash data. Placebo tests of weekends and proximal hours, as well as robustness checks to account for the reporting bias in crashes, confirm that cell phone use does not result in a measurable increase in the crash estimates of the relative rise in crashes and call likelihood at 9 pm imply a upper bound in the crash risk odds ratio (and a 1 upper bound of ) under 3 The periodicity evident in Figure 3 is due to the aforementioned reporting bias in the timing of accident :30PM9PM9:30PM10 PMAverage number of scaled moving callsMonday to ThursdayWeekendFridayTime (1-minute bins) Figure 2. Cell Phone Call Volume from Moving Vehicles for California from 8pm to 10pm in 2005 VOL . 5 NO. 3 95 BHARGAVA AND PATHANIA: Driving under THE ( cellular ) Influence credible assumptions regarding evening cell phone use.
9 This not only rejects the fold increase in crash risk estimated by RT, but the confidence interval of our estimate fails to overlap with that of RT. The analysis further suggests that cellular use is not analogous to drunk Driving as some policymakers and academics have averred. The upper bounds of this study easily rule out the crash risk of 7 associated with positive levels of blood alcohol and the crash risk of 13 associated with illegal limits of blood alcohol (Levitt and Porter 2001a).Our finding is subject to caveats. First, we assess only the local average treat-ment effect of cell phone use across all drivers and Driving conditions around 9 pm from Mondays to Thursdays. Comparisons to other studies, including RT, should be tempered by the recognition that different estimates may reflect distinct local treatment effects. While we observe no obvious threats to the external validity of the present study, such validity rests on complicated differences in traffic patterns, driver composition, and the mix of call type at night from the remainder of the day.
10 Second, while the upper bounds of our study may reject prevalent estimates of the literature, they may still constitute an economically significant level of crash risk. In light of this, we document the substantive implications of our confidence interval for the cost-benefit calculations of policymakers. Finally, our research design does not distinguish between handheld and hands-free use. However, we note that hands-free use was quite uncommon during our estimation period and that laboratory research has generally not found differences in crash risk across these employ two additional empirical approaches that confirm our finding that cell phone use is not associated with higher crash rates. A first approach exploits the nonlinear and heterogeneous take up of cell phone technology across the small-est geographic regions for which data on cellular ownership is available.